This is the second in a series of blogs, the DNAC Instant Demo tour.
Prior blogs in this series:
In this blog, we’ll cover getting into the Instant Demo and a scattering of topics within DNAC to give you a rough overview and a sampler of items in DNAC. In the next blog, we’ll do a deeper dive on Assurance to show in some detail how DNAC can be quite useful in managing your network.
Instant Demo Links
A link to the DNAC Instant Demo can be found in https://www.cisco.com/c/en/us/products/cloud-systems-management/dna-center/demos.html.
Instead of the above link for the Instant Demo, you can go directly to https://www.cisco.com/c/en/us/products/cloud-systems-management/dna-center/instant-demo.html and skip below to the 1-on-1 demo request part. View the Instant Demo access instructions, including credentials.
As noted previously, you’ll also see there that Cisco provided a self-guided demo guide for the Assurance component. Which is great in terms of showcasing some of the value DNAC brings to its users.
Let’s get going. Please open Chrome (recommended browser) and visit https://dcloud.cisco.com/content/instantdemo/dnac-demonow-instant. If you haven’t done so recently, you’ll need to use your Cisco login (and Duo), then use the demo credentials to get into the online DNAC.
>>>Documentation: New and Changed Information
This documentation section is not relevant for our tour.
>>>Documentation: Get Started with Cisco DNA Center
This documentation section contains some first-use info, which clearly doesn’t apply to an up-and-running demo. And getting logged in, which the Instant Demo instructions cover.
The documentation then gets into exploring the top-level GUI. That is very much my intent here, as well as visiting some of the DNAC material to convince of its value.
What’s In It For Me?
I firmly believe any course, training, or demo MUST start with “WIIFM” (What’s In It For Me). Along the way, we’ll visit some of the items, including a few that just don’t quite fit some of the later tour sections.
The next blog includes a deep dive on Assurance, which really shows the value of DNAC.
DNAC Dashboard
Tour item: When you log in, you’ll see the DNAC home page (dashboard). It shows various dashboard items summarizing what DNAC knows about the network. You can click on them to drill down and explore. To return to the main dashboard, click on the words “Cisco DNA Center” (upper left).
Be sure to scroll down on the dashboard page to see quick access to some of the DNAC tools at the bottom of the long page.
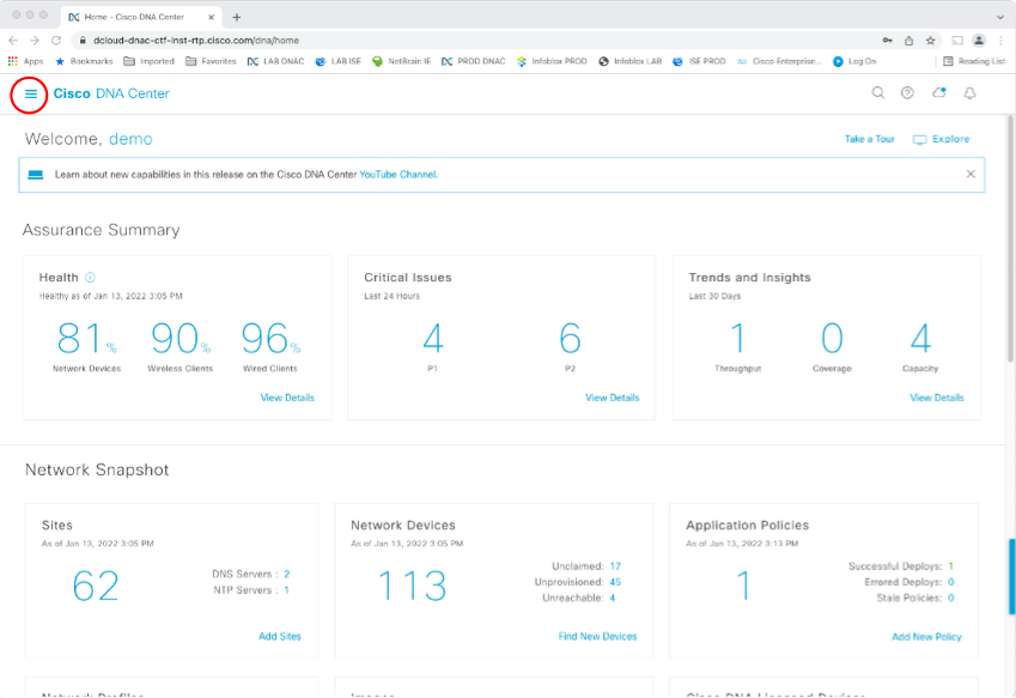
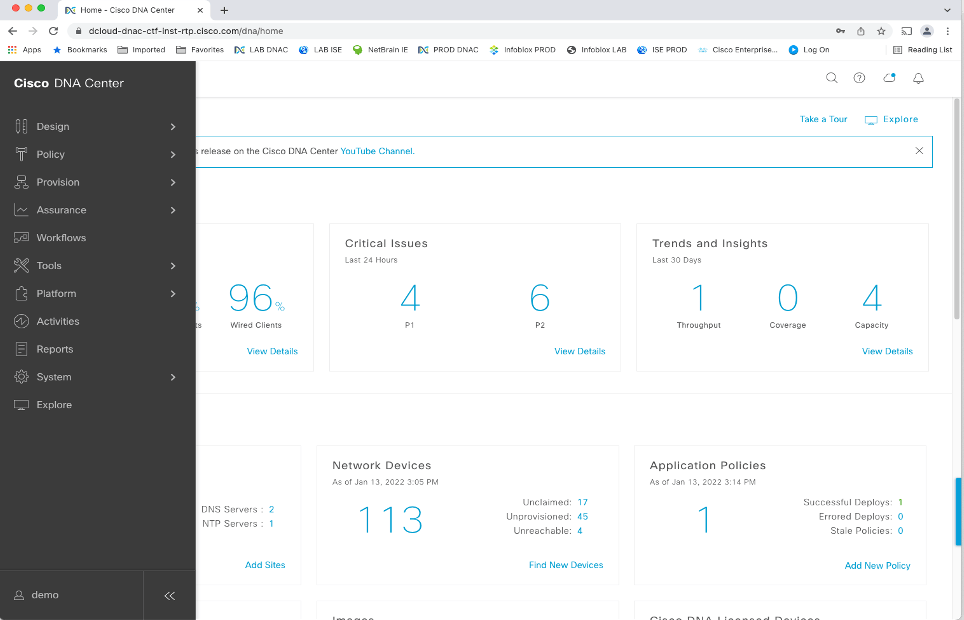
Tour item: Note the menus in the upper left corner, reached via the icon with the three horizontal bars. I highlighted it in red above. Feel free to explore them. Click on each to see the next layer of menus.
Tour item: Click into Critical Issues and explore. We’ll revisit this in more depth in a later blog, so I have not included a screen capture.
The key thing to note at this point is the dashboard provides a network overview with drill down to details. If you want, you can now drill down into some of the other items on the dashboard. They should be self-explanatory.
The color-coding indicates severity. The timeline at the top shows the approximate timing of alerts.
Tour item: Note the icons in the upper right. Search, Info, etc. The Cloud has a mark superimposed if there are software updates for your devices. The Bell is for notifications, red dot for new notifications.

Tour item: There is interactive help that shows up at the bottom right (blue bar in the above screen capture). Hover the mouse over it, and it will extend out. Click for walk-through guidance on some tasks. You can drag it elsewhere.
We’ll now visit a couple of items just to give you the flavor of all the functionality built into DNAC (and covertly cover a couple of useful items that don’t fit in well with the later tour.)
Topology Maps and Diagrams
Tour item: Via menu, visit Tools -> Topology, then click on North America on the left. Click on the circle showing 12 (sites) in California. That should take you to a screen like the following. You may want to zoom in to see the San Francisco area better.
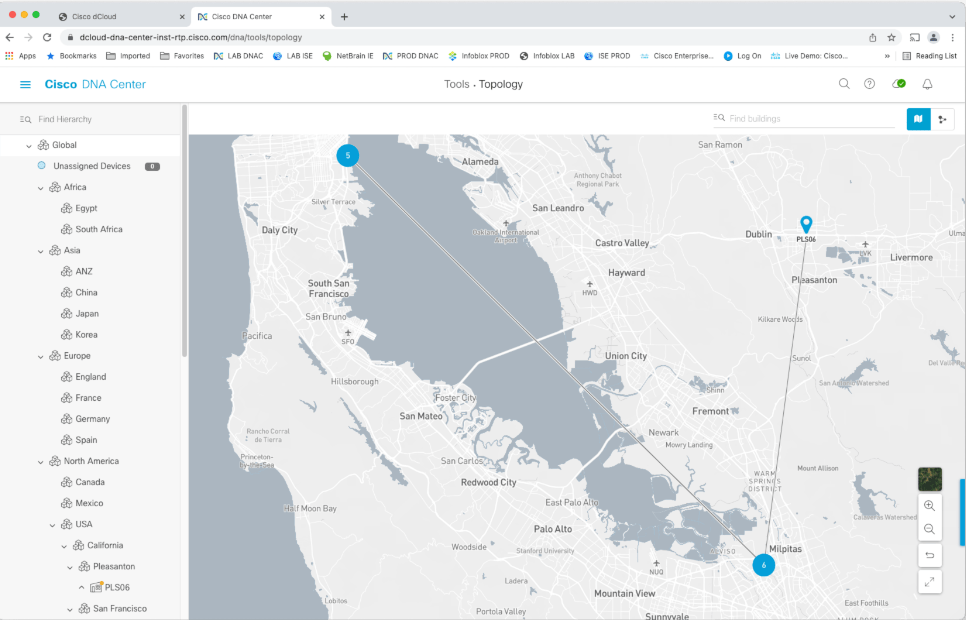
Explore the auto-generated network diagram.
Click and drag to move the diagram. Double-click zooms in. Or use the plus/minus icons on the bottom right.
DNAC knows the location of buildings, so it can show you maps down to the street level.
Double-click on the circle with 6 to see San Jose / Milpitas.
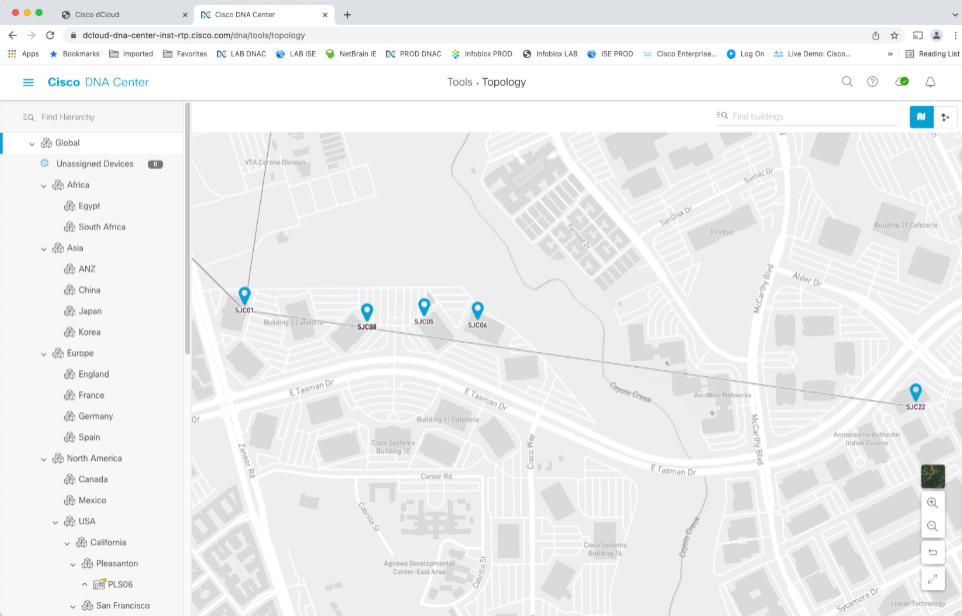
We will revisit this in a little more detail later in the series. For now, the key point is that DNAC gives you a way to organize devices you manage, and easily coordinates that with maps that also show status.
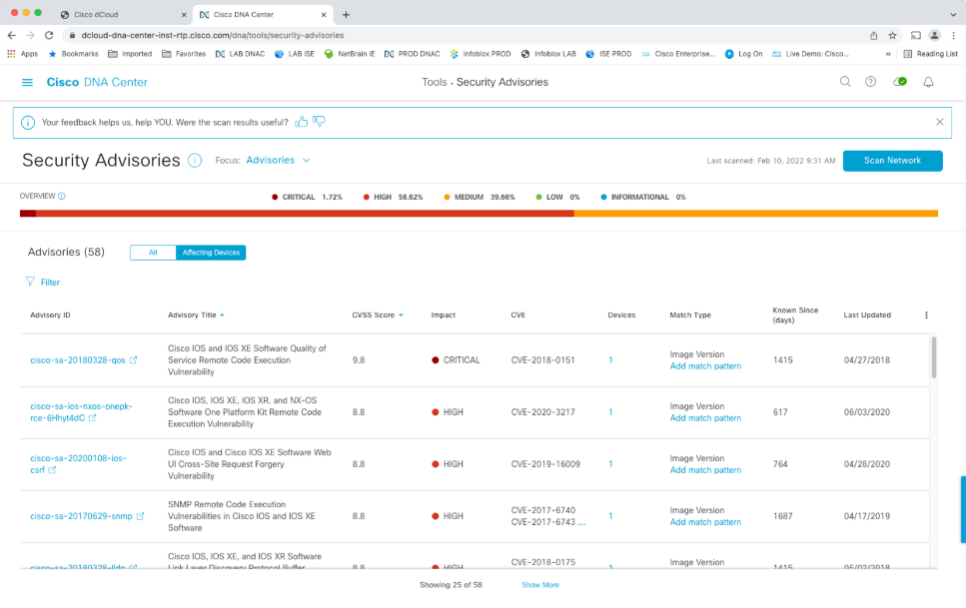
Security Advisories
Tour item: Click on Tools -> Security Advisories. Click into one (blue link); explore.
This should be self-explanatory.
>>>Documentation: Identify Network Security Advisories
Create a QoS Policy
Tour item: Let’s take a quick look at how DNAC can be used to configure QoS. This is potentially a major simplification of specifying QoS policy and a huge labor-saving feature! NetCraftsmen has been using it for deployments. Unlike humans, DNAC doesn’t get bored pushing configlets out, and doesn’t lose lines out of what was supposed to be configured.
Note below that this is the sort of thing Cisco describes as “Intent-Based.” You tell DNAC what your policy wishes are, and it handles the details of pushing that out in the CLI that various types of devices understand.
Click on Policy -> Application.
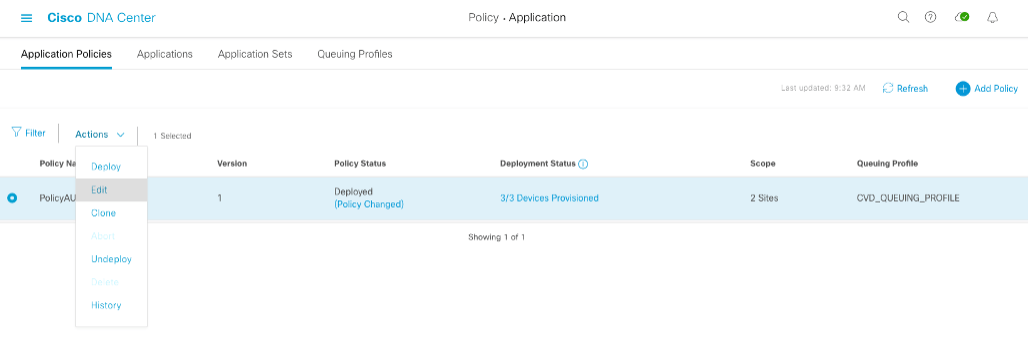
Then choose Actions -> Edit.
>>>Documentation: Configure Policies
The three empty shaded rectangles are your policy for QoS. Click on Unassigned at the bottom to view application classes. Scroll down to see the application classes at the bottom better.
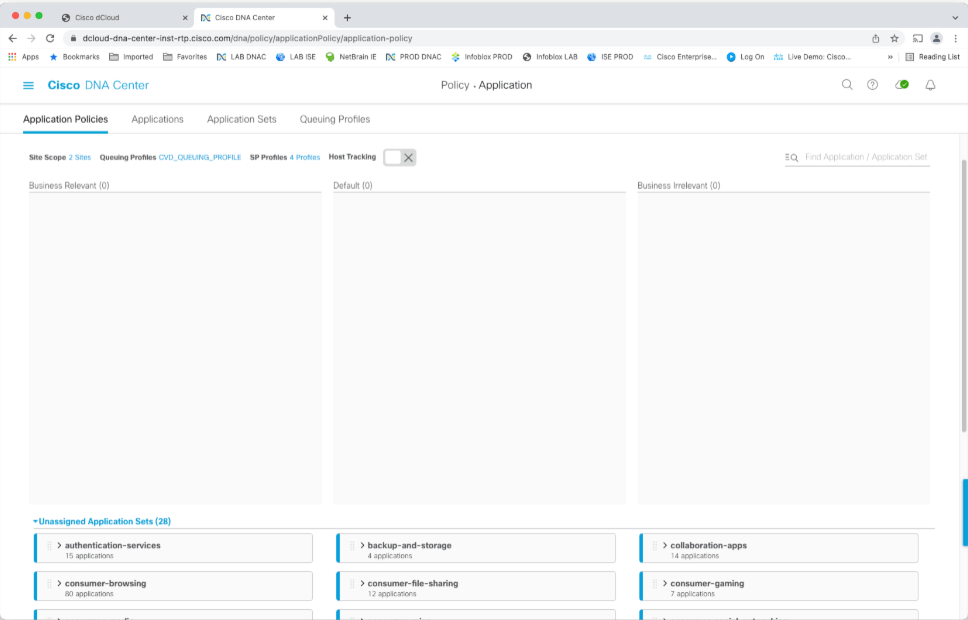
You can create a QoS policy by dragging and dropping traffic classes (at the bottom) to one of the three categories. The Deploy button is how you would push the policy out to devices. Note that you do not have to do with the many details of different QoS configuration commands on different device types!
You might also click on the ‘+’ sign – that’s how you add custom applications that are on your network.
All in all, this is a much easier way to do QoS than building and pushing per-device type QoS configurations!! And it apparently works with older devices such as Cat3850, 4500X, etc. And Nexus 7K. (But not N9K the last time I looked.)
Click on Queuing Profiles. This shows your QoS class percentages: what percentage of the available bandwidth is allocated to each class.
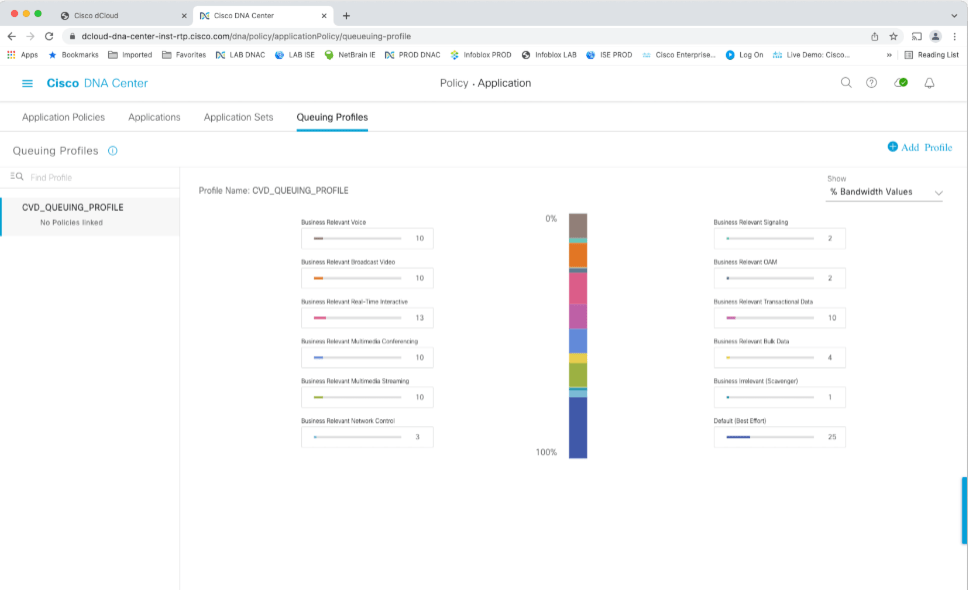
The drop-down menu (it says “Bandwidth Values”) on the right also lets you see/change which class is using which DSCP value. (I’d prefer to be able to see the DSCP value assignments on the first of the two screens, as well, as a reminder of the current settings.)
I will note here that you still should probably have some idea of how QoS works, but this GUI-driven approach greatly simplifies creating a QoS policy and deploying it.
Compatibility
To see if your device/code version is supported for QoS and other DNAC functions, you can check the supported list (“Compatibility Information”) for device types and code versions. See https://www.cisco.com/c/en/us/support/cloud-systems-management/dna-center/products-device-support-tables-list.html
Conclusion
At this point, you should have gotten a little more comfortable with the DNAC GUI and seen that it provides data to help you operate your network. You’ve seen that DNAC can show you a network diagram, by site or group of sites, hierarchically. It shows health problems, codes security items, and lets you configure (provision) QoS.
We’ll see further capabilities and details as we get deeper into our tour.
![]()