Kentik presented last at Networking Field Day 16 (#NFD16) and did a great job. I started with high expectations, since I was aware that previous KentiK NFD presentations received high reviews. And I was not disappointed.
Who or what is Kentik, you might ask? (Especially if you’ve missed its prior Network Field Day presentations.)
If you look at Kentik’s website, you’ll see NetFlow, reporting in SaaS form, and maybe BGP. Dig a little deeper and you’ll see snazzy graphics. At least, that’s where I previously had Kentik positioned in my head. I’ve been watching the NetFlow space for a while. My impression: There’s a lot of “me too” in the space — quick products that don’t support good drill-down, widely used products with rather limited data and reporting, and some products with slow/hard reporting. All to be avoided.
Scrutinizer has been on my “good NetFlow product” list. Kentik is certainly on that list as well!
The other thing I see with NetFlow tools is that after we do “who is eating my WAN bandwidth” and some other basics, many organizations don’t use the data that much. That’s a shame, since it can really help figure out what the flows are for an application — but most tools make it hard to stitch that together. I see that as why a lot of the NetFlow-centric products have pivoted into a security product pitch — witness Scrutinizer — there’s more spending there, and the product is more likely to get ongoing use. (Pardon any cynicism.)
![]()
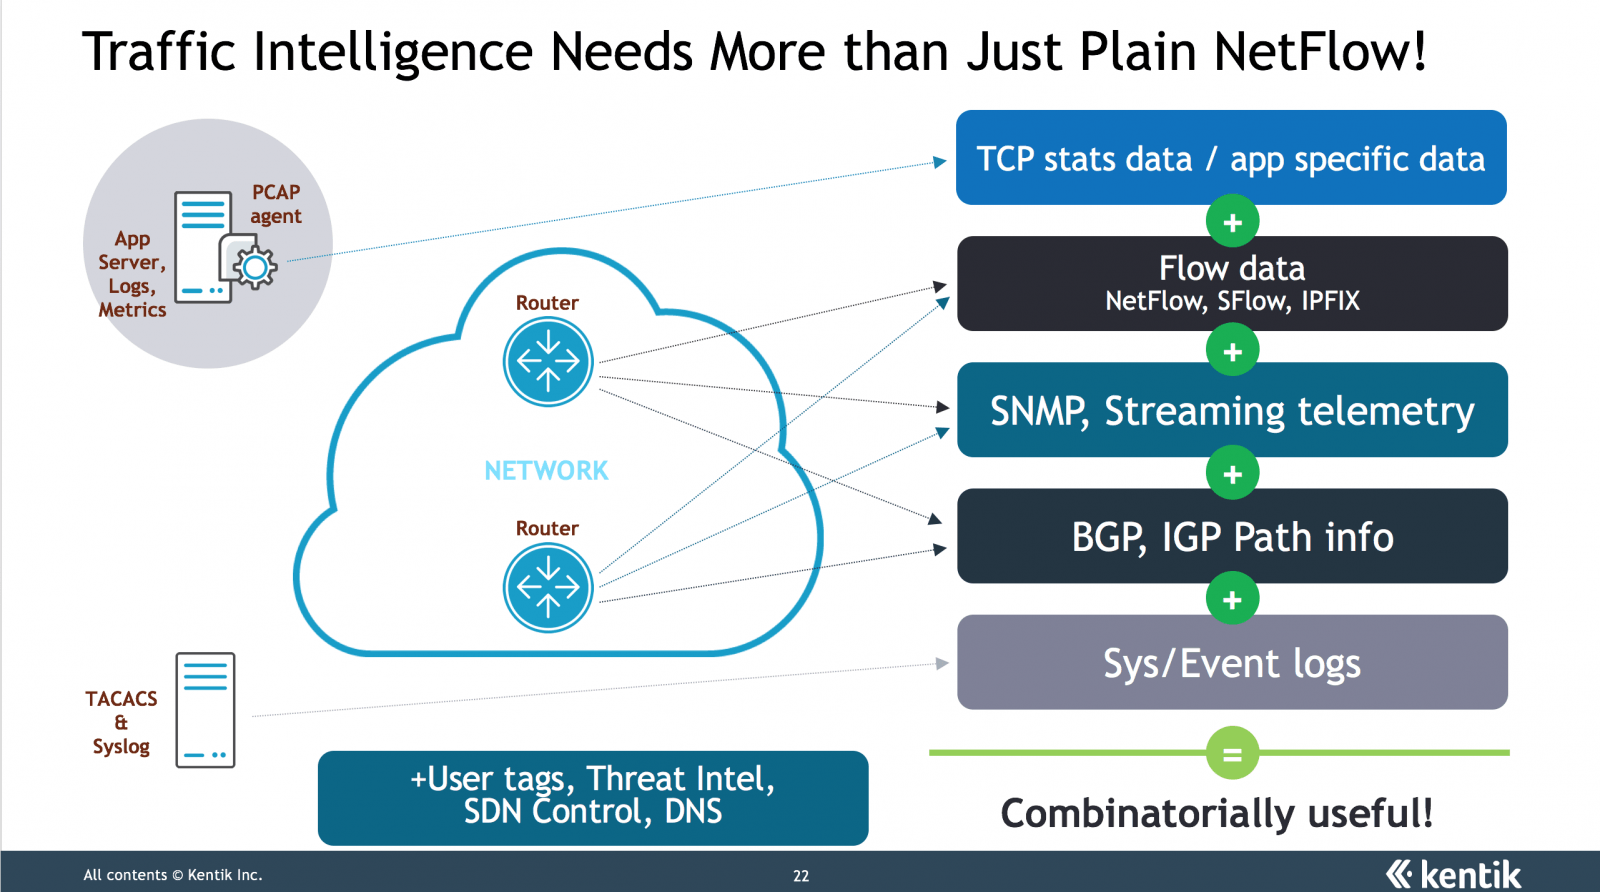
After the presentation, I’d say Kentik is a company on a mission, and is now building on a strong database, reporting, NetFlow-based foundation:
- Kentik leverages big data and web-scale coding techniques, with some tools it built as well as open-source and powerful cloud tools.
- Kentik does SaaS, but if cloud is not for your organization, it can be done on-prem.
- Kentik is incorporating more and more data from SNMP, BGP, syslog, and other sources (ntop or similar tools for general performance metrics).
- This data is finding its way into dashboards and reports.
- Kentik already uses its own product engines (with such data sources) to manage its infrastructure: servers, apps, databases.
Kentik had me when I heard:
- Quick usability, large built-in set of queries, dashboards, and reports
- DIY (do it yourself) is large effort (my take: too many of us are taking cheap tools and pouring lots of hours into making them more useful)
- Detect anomalies (versus read reports or watch graphs)
- Rapid reporting
- Pulling together data across stovepipes, getting away from siloed appliances
If you’ve read my prior network management blogs, those are hot buttons for me. Most network management tools have legacy databases, don’t handle time-series data efficiently, are slow to report, and provide raw data rather than alerting to anomalies and providing actionable information. Most are also toolkits, requiring a lot of tweaking. Really? We don’t know how to automatically threshold and alert? We can’t use some basis statistics, e.g. running averages, with perhaps 15-minute buckets of data to detect anomalies (let alone machine intelligence)?
There are also a couple of tools that are SNMP polling monsters, proving that with the right approach, one server can efficiently pull in massive amounts of data. We’ll come back to that sometime in another blog about (not) polling IP phones. Those products have the data. The analysis and reporting, not so much? (Among the ones I’ve seen, anyway.)
It’s also great to see a tool that leverages all the wonderful coding tools and new technologies, and has a strong vision. I should probably also say “API.” And that gets the idea that we have to make the applications work across application, server, storage, network and security teams — break down the silos!
As we got into the demos (Avi Freedman, CEO, is clearly slide-averse), we touched on a few other themes. Well, a lot of things, actually — too much for this space (did I mention, watch the videos?). Among them:
- Kentik’s customer base is about 50/50 service provider/enterprise, going to be pushing enterprise features more now. (My wording.)
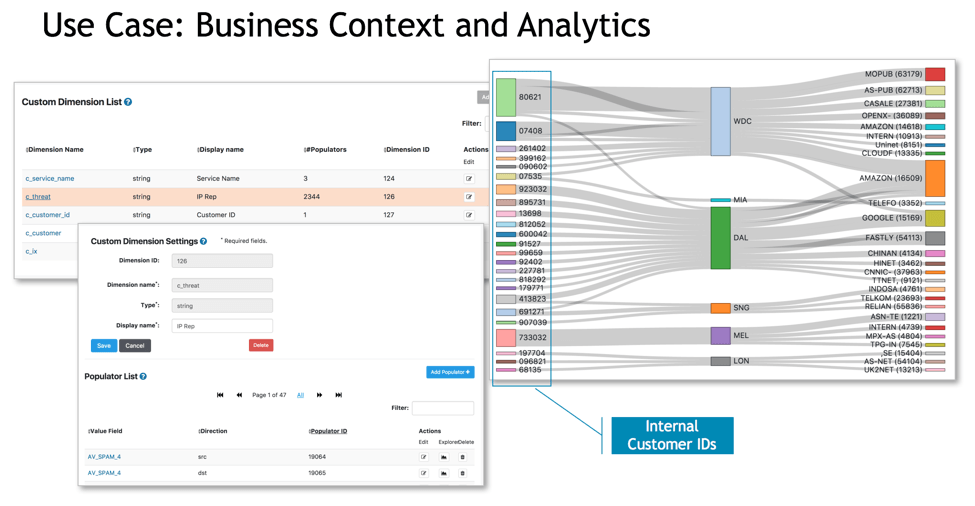
- Kentik now supports “custom dimensions” such as geo-location, sites and regions, DNS, etc. — the goal being to convert technical reports (raw IP address) into forms meaningful to the business side of the organization.
- Among them, BGP data lets Kentik get at service provider/WAN or web transit costs, associate WAN or infrastructure costs with application volumes, etc. In particular:
- Capacity planning data
- Traffic by route
- “Ultimate exit” (as in reporting based on how traffic exits your network)
- Layer 7 reporting re: HTTP and DNS
- Threat intelligence: DDOS and alerting: security info for the enterprise, but not interested in becoming a SIEM
- External integration (feeding existing SIEM, feeding Splunk, feeding Grafana for operations, etc.), PagerDuty
As an example of the custom dimensions, the following image shows how DNS data can complement NetFlow data to show which CDNs (content delivery networks) a company’s users access most. Yes, Kentik does Sankey diagrams!
I haven’t really touched that much on the security aspect. It’s also there; see the presentations.
Kentik did talk a lot about their internal architecture. There’s a fascinating story there, about learning what they needed and how their product toolkit evolved to address their needs, providing the robustness and speed they wanted. But it’s not my story to tell (nor do I have space to do so).
Conclusion: If you’re looking for actionable data, especially NetFlow-based information for now, take a look at Kentik. And think beyond NetFlow, because Kentik certainly is doing so.
Comments
Comments are welcome, both in agreement or constructive disagreement about the above. I enjoy hearing from readers and carrying on deeper discussion via comments. Thanks in advance!