This blog is an update about a useful network management/operations product, NetBeez. I drafted it as part of a small series on tools that monitor response time (and generally also do other forms of synthetic response measurement).
Since I drafted it, NetBeez presented at Network Field Day 26, which I was a virtual delegate at. I plan to write a separate (and shorter) update blog to post on LinkedIn, updating this blog.
General User Experience Monitoring
The general category NetBeez fits into is “scalable tools that monitor response time”, a.k.a. measuring user experience.
There is a variety of similar tools available, including:
- Cisco ThousandEyes
- Catchpoint
- NetBeez
- AppNeta
- Obkio
- zScaler: Apparently, their workstation agent can now provide some of this sort of functionality.
Other broader products with “synthetic monitoring” include:
- Riverbed NetIM
- Kentik Synthetics (part of their overall data platform)
NetCraftsmen is a Cisco Gold Partner, so we certainly are happy to demo/sell ThousandEyes or provide knowledge transfer, ongoing management, or professional services for it. We have also partnered with Catchpoint for a Digital Experience (DX) Monitoring service we provide. Blogs about both will follow.
If you google search the general topic, you’ll find several articles such as https://www.trustradius.com/end-user-experience-monitoring-euem. There are also some higher-end tools that do much fancier application monitoring and a lot more, including:
- Cisco AppDynamics
- Riverbed Aternity
Generally speaking, these products are a cloud-based and/or on-premises management platform controlling devices that you position around your network. You use the web controller to tell them what to probe or poll, and you get back reports such as success/failure, response time, or traceroute/path to a target site. This then provides you with a good read on which key applications are down or slow responding, where locations are experiencing the slowness, and perhaps more. If the tool provides historical data, you can see when the problem began and perhaps correlate that with logs or other tools to help find the root cause.
For what it’s worth, I used to have AppNeta devices for a demo to customers running out of my house. And I still have a NetBeez device running, which lets me stay current on features and the GUI.
My co-workers and I have used NetBeez in a couple of troubleshooting scenarios. Doing probes from two points allows you to compare “differential” response times from the two locations. For example, user desk versus the edge of the network: is the problem internal or external?
Another potential use: CEO having poor wireless responsiveness, use one of these products to gather history and see if changes are providing any improvement.
With the advent of the cloud, some of the vendors saw potential sales by producing an image for a virtual version that could be run in your VPC.
Other vendors (notably ThousandEyes and Catchpoint) invested in putting farms of devices or Linux VMs or something in various key global locations so that you could poll traffic inbound to your website or other application, etc. Generally ping or HTTP(S).
With Work From Home (“WFH”), some of the vendors produced a Windows and Mac version of the agent as a way to monitor user experience. Oh, and if you have a “spy” on the user’s computer, maybe it could check and report some other data, such as the strength of their wireless signal or first external hop response time. Is the ISP slow or dropping a lot of packets?
NetBeez
Ok, so let’s now focus on NetBeez, with follow-on blogs about Thousand Eyes and CatchPoint and what they do differently or uniquely.
I first became aware of NetBeez via Tech Field Day’s Network Field Day 9, pretty much a launch for the company. You can find that and more recent content at https://techfieldday.com/companies/netbeez/.
NFD9 was memorable because NetBeez handed out a sample device to each delegate, getting everyone’s attention (“shiny new toy must try it out”), and was able to use the management platform for “live” demos. They’ve left it active for us, which is helpful when I try to explain what NetBeez does. With other vendors just providing demo screencaps, not so easy.
Key components in NetBeez: Raspberry Pi, Linux. Small, cheap hardware, flexible programming platform. I think this indicates a wise decision in terms of time to market and the ability to rapidly add features.
It doesn’t hurt that the NetBeez team innovates fast. They partnered with Cisco and containerized their agent, so you can run it on a Cat9K switch. You can apparently also run it as an app on a Cisco ISR router. And I believe they did the container thing before Cisco bought ThousandEyes and containerized it.
NetBeez is also now available in VM form for internal or cloud use.
(Speculation: ThousandEyes was chosen by Cisco perhaps due to bigger installed base, worldwide probes in place, higher prices/profit margin potential?)
Basic NetBeez
A picture is worth 1000 words, so I’m going to include some screen captures with few words. These will show the reporting side of NetBeez. I’m not going to write a tutorial on how to set up the tests. At least not in THIS blog!
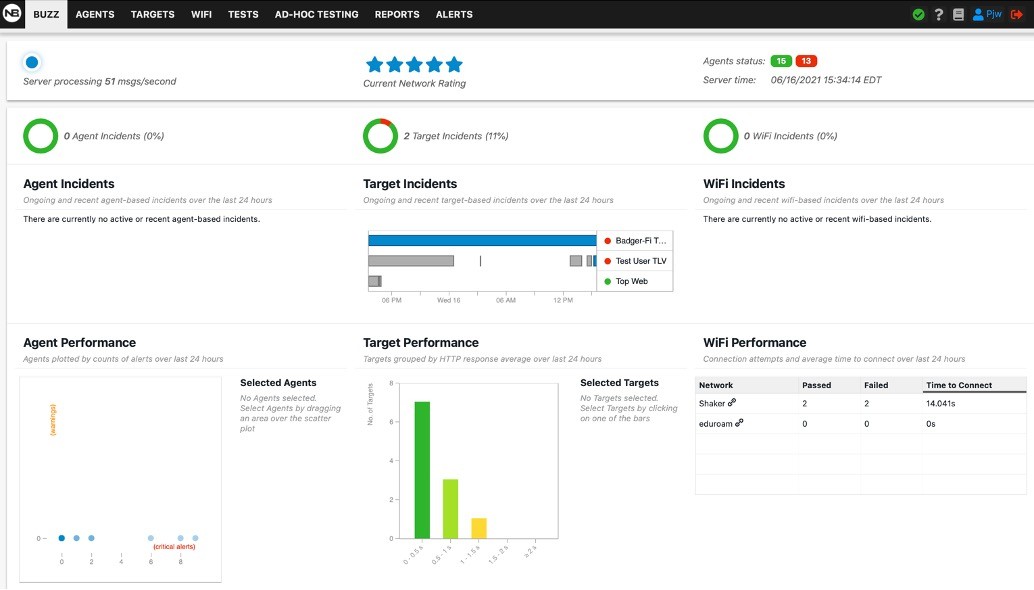
You probably will not be surprised to learn there’s an overall dashboard summarizing all your agents, shown below.
Since I only had one probe, I went directly to its dashboard.
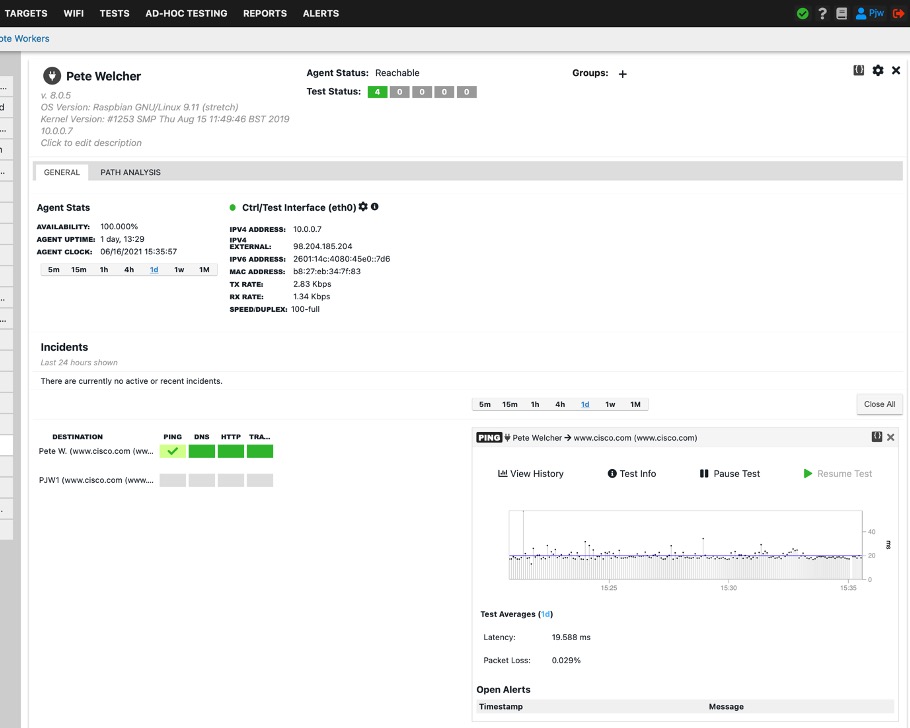
What you see there is a summary of what that probe is measuring. You can also click on one or more of the green rectangles to view a graph of the performance data. My ping to cisco.com (well, the CDN front-end nearby) is pretty steady, around 20 msec, with occasional peaks or drops.
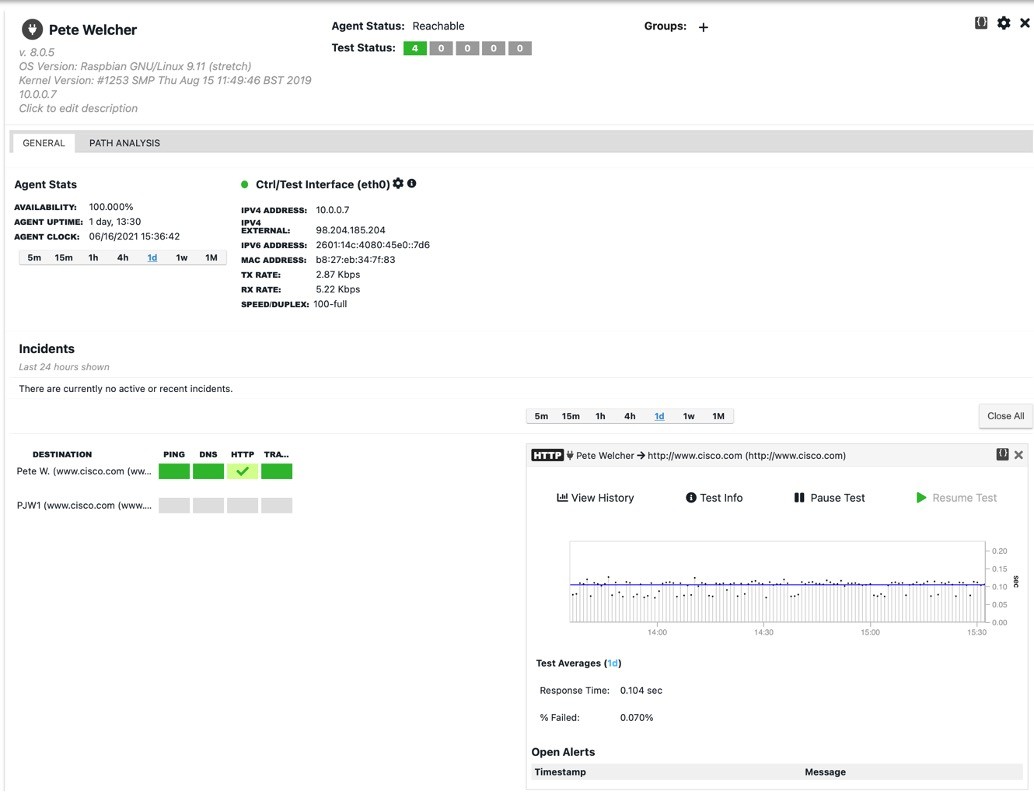
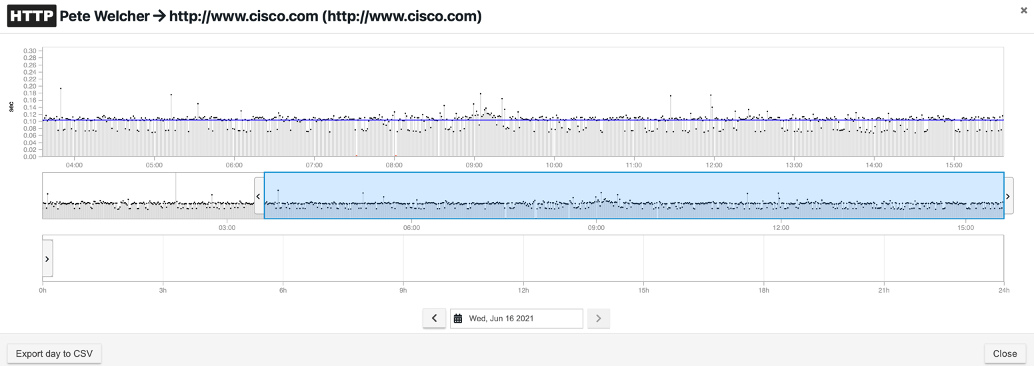
The following shows the HTTP response time data.
The GUI is fairly straightforward: you set up tests under “TESTS”, then assign them to various probes. You can also run ad hoc tests, as shown below.

Ad Hoc reports can also be set up to run periodically from the Tests tab. Do bear in mind that a Pi computer has limited CPU, so it can only do so many things at one time. VMs are probably more capable.
I went to the Tests tab, chose Speed Tests, and pulled up my home Speedtest.

It is set to run with cron “0 * * * *” (Linux cron job). I’m not quite sure why that’s showing up as 10 AM. The agent clock shows the correct time. It won’t let me change it, presumably to prevent adverse impact on other tests.
FWIW, I’m supposed to get 400 Mbps down and ten up, and usually do when measured from my Mac. For the aging NetBeez probe, I have only had a 100 Mbps port, so 85 isn’t bad, perhaps CPU-limited.
Advanced NetBeez
Now for some of the new / even more cool features!
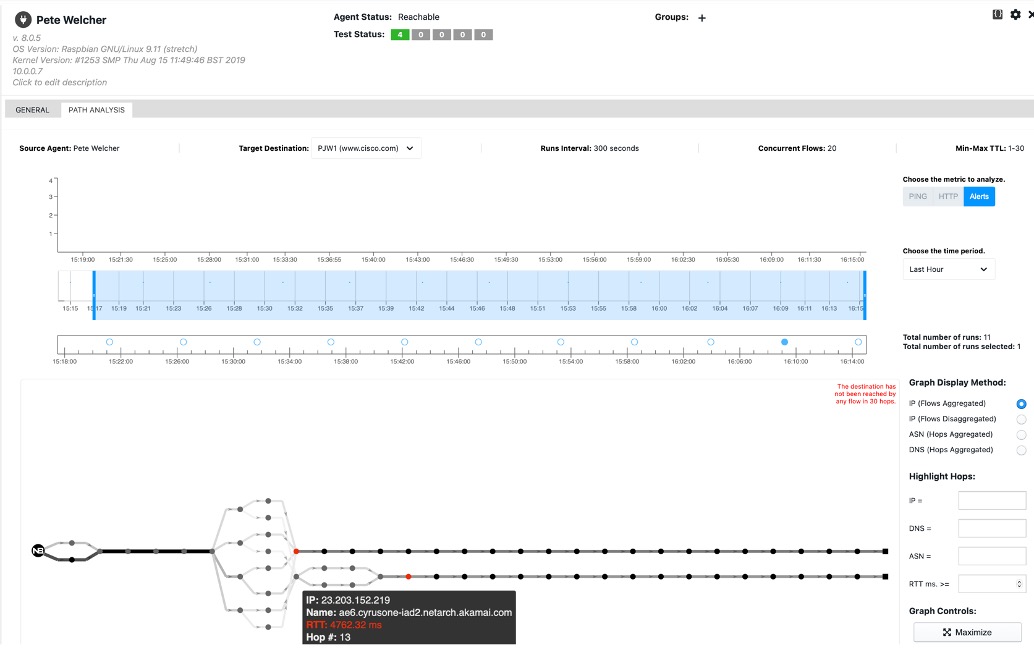
How about a path trace, showing the various paths your traffic takes …
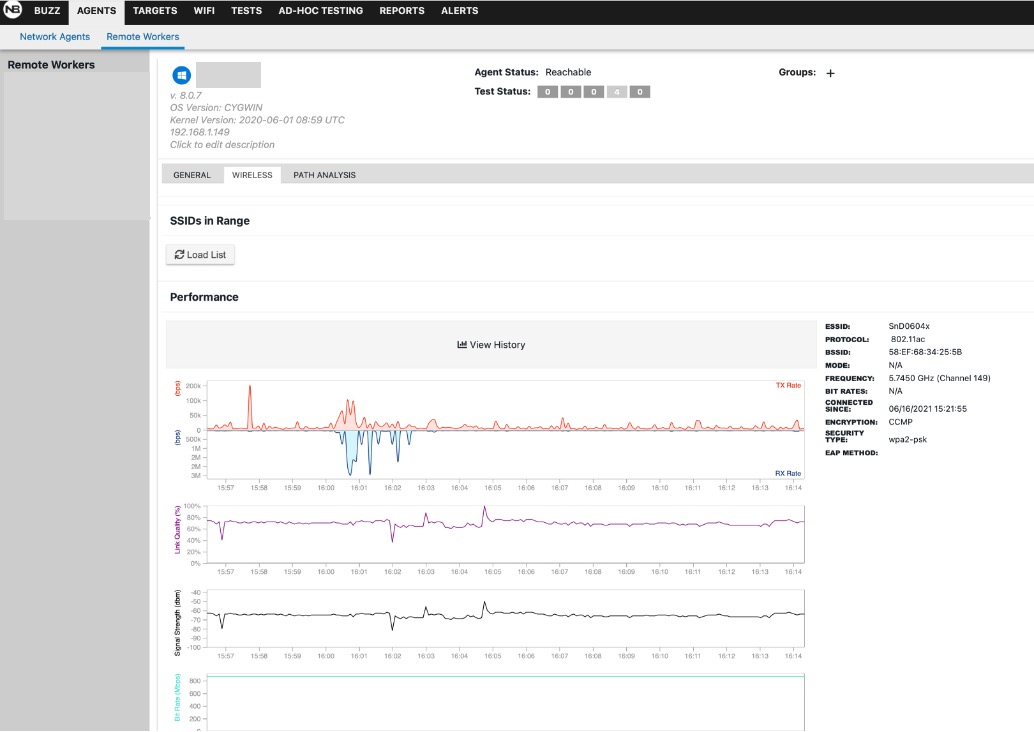
And here’s a sample of some data from a remote worker agent:
Product Notes
It’s now short shrift time…
- Wired / wireless probes
- Forms: physical device (Raspberry Pi-based), container (for Cisco switch), and VM or agent form as well
- Remote Worker Agent
- WAN / SD-WAN monitoring
- WiFi monitoring
- WFH (Remote Worker) UX monitoring and troubleshooting agent on the workstation
- API, e.g., for managing large numbers of NetBeez.
New / Recent Features
- Path analysis
- Ad Hoc packet capture on WiFi agents
- Run wired tests on a WiFi sensor’s Ethernet port
- Now shows Jitter, MOS statistics where available
Other Interesting Features
- DNAC deploy to Cat9K (Docker)
- Or run as an app on IOS-XE 16.9.x Catalyst
- Cisco ISR: run agent as virtual service (app)
- Installs on Cumulus Linux
- Extreme switch integration via IAH (integrated Application Hosting)
- SlackBot: https://netbeez.zendesk.com/hc/en-us/articles/210141766-NetBeez-Slackbot
- PagerDuty integration
- Runs on PlumSpace Smart SFP
- Splunk integration
RTFM
I like publicly available documentation. NetBeez’s is terse but sufficient.
FWIW, I’m not so wild about other vendors that require registration or product ownership to read the documentation, as several router/switch vendors do. Are they hiding poor documentation, or why the limited access? I’ll be kind and won’t name names here.
Relevant Prior NetCraftsmen Blogs
NetCraftsmen has several posted blogs on the topic of Digital Experience / User Experience:
- https://netcraftsmen.com/digital-experience-monitoring-addressing-those-nagging-network-performance-problems/
- https://netcraftsmen.com/switch-to-digital-experience-monitoring/
- https://netcraftsmen.com/poor-work-from-home-application-performance-drives-digital-experience-dx-monitoring/
- https://netcraftsmen.com/digital-experience-dx-monitoring-intermittent-bgp/
Conclusions
NetBeez is an interesting product in the “light” User Experience monitoring space. Having one or two probes can be useful for spot troubleshooting performance problems. Having one or more probes at each site and selected probe agents on user workstations can provide much more thorough visibility into the scope of any outages or performance problems.
I see NetBeez as possibly a good fit for a consulting toolkit. It seems to also align well with small to medium businesses, where simplicity and cost are significant factors.
![]()