As you may know, I’m an occasional TechFieldDay (#TFD) delegate, mostly at general Networking (#NFD) and Service Provider events, because it’s a great way to learn about startups and young companies and new technology offerings. Recommended!
The company Selector.AI came across my radar by presenting at a TechFieldDay (TFD) event.
Selector is a startup in the AIOps space with an initial focus on the network. And their TFD-recorded presentations were interesting and educational.
This blog attempts to describe what Selector does. It is somewhat screen capture-heavy, with images from the recorded videos of the TFD sessions. Why? That helps tell the story – and may provide you with an incentive to go watch the videos for more details!
Selector.AI caught my eye because everyone is grappling with the question:
“How do you turn voluminous data (SNMP, telemetry, log) across multiple domains (network, storage, app, cloud, multi-cloud, Kubernetes, security, etc.) into actionable information while greatly reducing the eyeball fatigue factor?”
At the time of the presentation, as a startup, Selector was mainly focused on the network domain. They expect to be able to fairly rapidly add coverage of selected other domains, e.g., cloud. I suspect security might be last on their list because there’s heavy competition there, in the SIEM (Security Information and Event Management) space.
For what it’s worth, for comparison, in the networking domain, Splunk claims some AIOps capabilities ($$$), and several other tools that claim to help. Notably ServiceNow (also $$$).
I’m not tracking the AIOps space closely, so I’ll drop a couple of names: BigPanda, Moogsoft, and move on. They have somewhat different product visions and approaches. I’ll share my perceptions, although I’m not in the optimal position to compare products. You need hands-on time to separate the marketing hype from the reality and dig into the details somewhat!
Since many networks already use Splunk and/or ServiceNow, one use of Selector might be to pre-filter events and telemetry data, only forwarding correlated items to the “Big Platforms”. That could arguably reduce the volume of events and general information being fed to ${BigPlatform}, hence cost. Hint: Selector’s pricing is not based on volume of events.
Selector’s main web page has a nifty animation summarizing what they do. A screen capture follows:
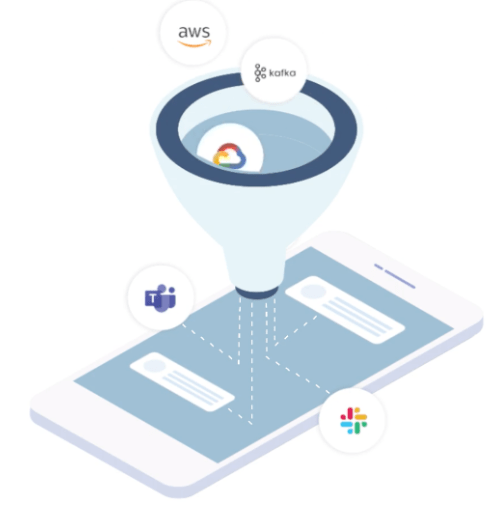
My interpretations of that graphic: events from e.g. AWS hit Kafka storage, get AIOps handling, and noteworthy items show up in MS Teams and/or Slack. Or the dashboard.
Selector’s Goal / Value
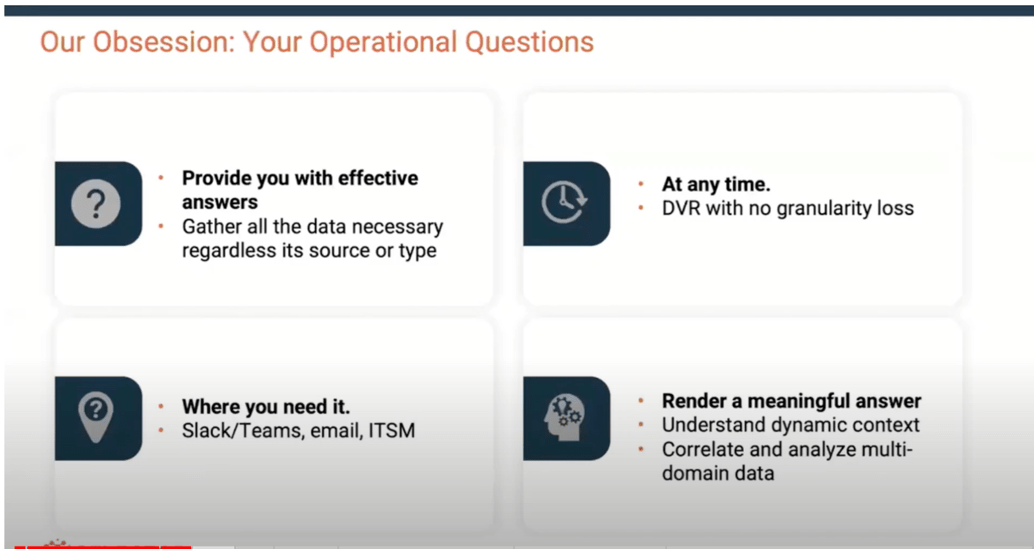
The stated goal is to provide you with correlated events you care about, to enable you to obtain effective meaningful answers.
This is done via a dashboard, but also Slack or MS Teams ChatOps. Drill-down and natural-language queries are supported. The idea is that if you see that something is amiss, you can drill down and find out what that alert is based on, exploring more deeply into the supporting data.
Selector summarizes this in the following graphic:
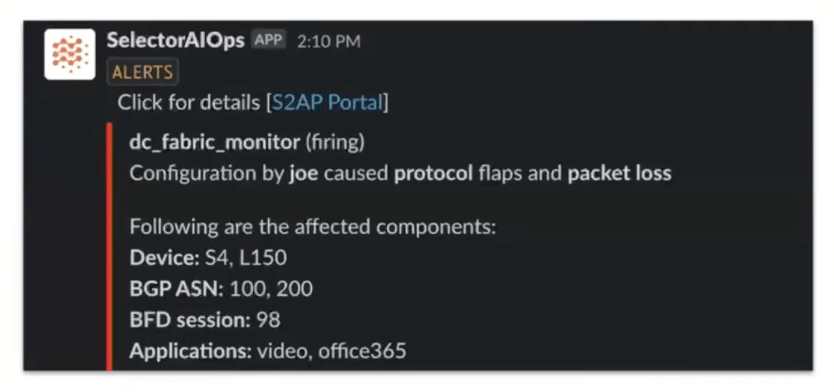
Example Slack Notification:
Not Re-Inventing the Wheel
I’ll award Selector points for not re-inventing the wheel, but focusing on integrating with existing tools, both those providing inputs (network management tools, etc.) and those on the output side. Of course, the drawback to that is you need to HAVE the other tools, plus do the integration. Which is basically part of installing and getting Selector working.
Selector needs some source of information about the network. They currently use NetBox for that, to provide a device and connection inventory, and likely other information.
How Does Selector Do It?
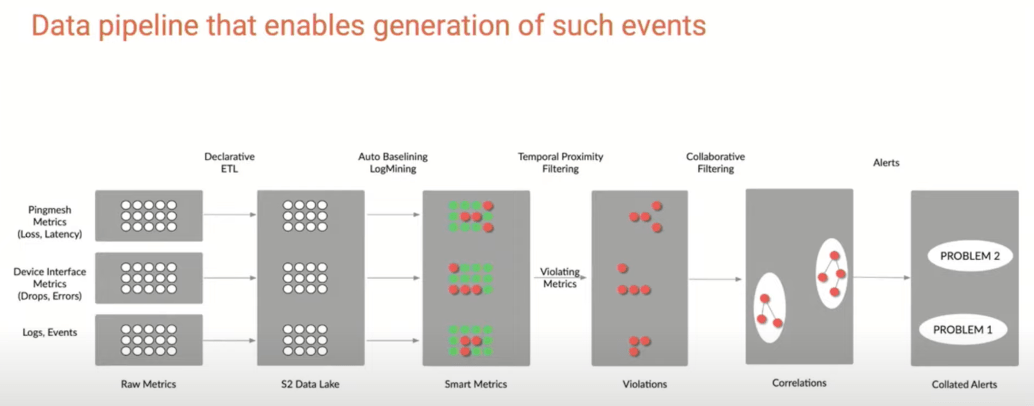
Selector used the following graphic to describe what they do. It isn’t simple! The video explains each of the steps shown below in more detail. I’m going to greatly summarize …
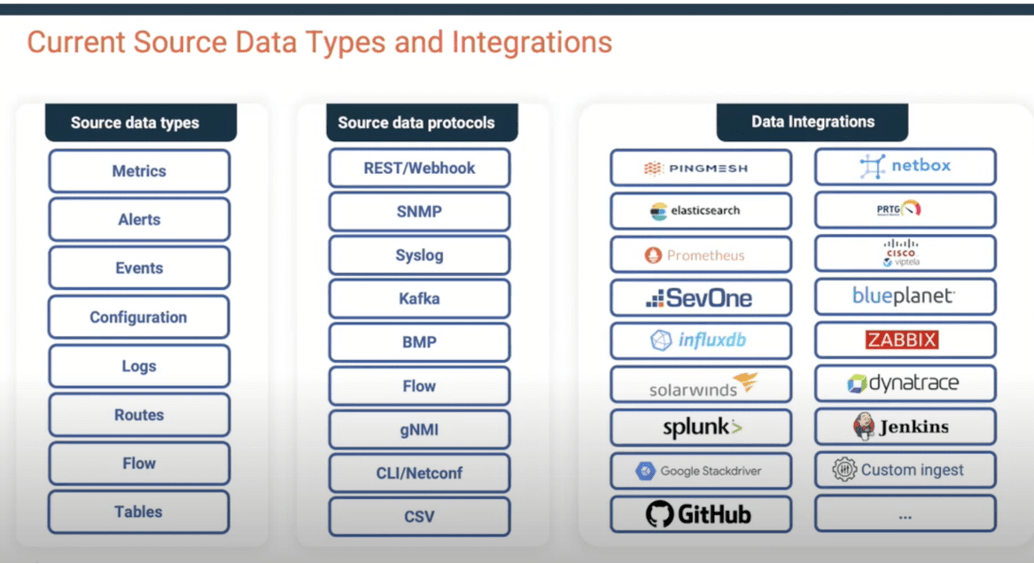
The raw input is SNMP and other performance data (telemetry), along with “pingmesh” metrics (think ThousandEyes/CatchPoint/Netbeez etc.) and log/event data. Apparently, Selector has its own “pingmesh” capabilities but can also ingest data from an existing tool (such as those I just named).
This data is stored in a “data lake”, with automatic baselining and log mining to produce “smart metrics”. Technologies such as Kafka and RabbitMQ are used to handle event data. The data lake could be Prometheus, InfluxDB, and Splunk, running locally or in the cloud.
Since telemetry is not standardized, Selector uses an ETL (extract, transform, load) compiler to generate parsers on demand.
As you can tell from some of the above name-dropping, this is intended to support scale-out and handle a high volume of input data. Collectors can be run at sites rather than centrally for distributed disaggregated collection. (Try saying that three times quickly!)
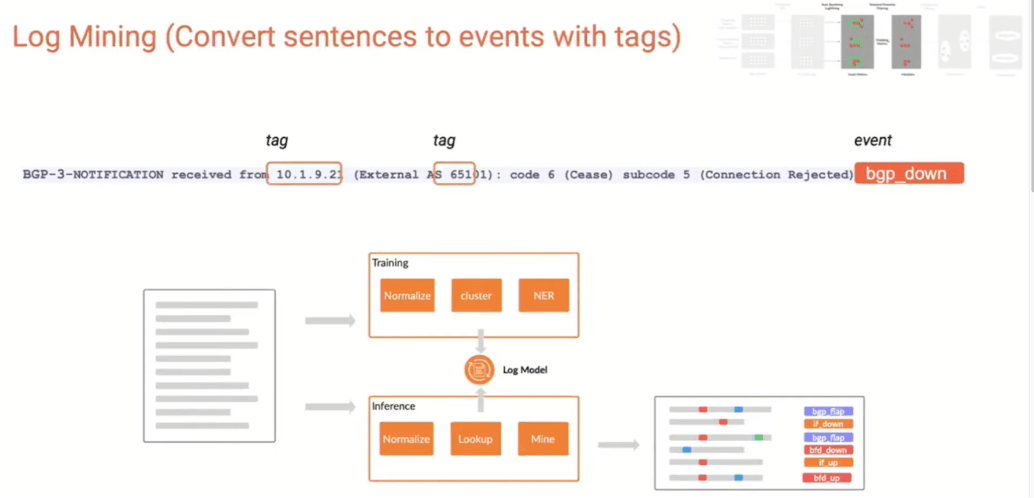
The bottom line is that numbers get converted to events and are baselined along the way. Alongside the telemetry and numerical data, log data is also mined, and converted to events with tags, including key information fields.
The following screen capture shows this.
When there is a data metric violation, temporal (time-based) filtering looks for other things that happened around the same time. A correlation engine processes those for high correlation and generates readable alerts. That seems like it would be much more efficient that relying on the Mark 1 Human Eyeball (outage, start checking logs, possibly across different logging systems, etc.).
AI is used in at least two ways: baselining and baseline thresholds, and the correlation engine.
The correlation engine uses tags that the system associates with data, and looks for events that have high degrees of correlation (roughly, high number of tags matching). This appears to be where some art comes in.
Then correlated information is processed into natural language for Slack, etc., and presented to the user/operator.
The TFD session recording goes into all this in more detail, I’m summarizing.
Selector claims that correlation works well when you do not try to incorporate deep domain knowledge.
Attempting to do so would require actually having such domain knowledge and take a lot of time to add relatively little value. Or so Selector says. I’ll note that this approach should, in principle, let Selector cover a lot of domains rapidly, albeit constrained by the data ingestion tool-specificity at the front end.
Claimed Benefits
Selector claims this approach has the following benefits:
- Single source of truth (SSOT): “no more swivel chair looking at multiple tool dashboards”
- Democratization of data access: English natural language queries
- Dynamic dashboards: you don’t need Grafana etc. experts building screens
- “First” cloud native SNMP/gNMI collector, observability stack
- Can front end ServiceNow, cutting costs
- Customizable to customer pain points
- Deployment is flexible: SaaS, on-prem, or hybrid
Re SSOT, I tend to think of NetBox or Nautobot in that role, so maybe SSOA (Single Source of Alerts) or SSOSI (Single Source of State Information)?
Other Key Info
Selector apparently comes with initial and follow-on support. This is clearly appropriate and necessary because integration with existing site tools is likely going to be necessary (data sources and sinks), and in addition some AI training and tuning may be appropriate.
Conclusion
Selector.AI sounds like it has great potential.
If you believe as I do that fingers cause many/most network outages, correlating configuration changes with outage or performance events seems like it should have high value! And yes, other tools notify config changes, but tying that to an outage or performance slump could be helpful.
They did mention application performance management (APM) tools, which are rather mature. I believe the context was not competing with them per se, more like using them as data sources.
They did talk about looking at application interactions instead.
What would be really useful, seems possible with Selector as-is, but I don’t know for sure if Selector can currently do this: if Selector can correlate application performance issues with network performance abnormalities, e.g., loaded links or links with high drops or latency, that could be very helpful. I’m thinking that if you have a tool such as ThousandEyes, CatchPoint, or recent NetBeez, that can do web page fetches and maybe “light RUM-like probes”, that might provide the data necessary to do such correlation.
I also heard something that reminded me of Kentik’s “Negative Roadmap”: they are also looking at what they do not want to do.
The overall presentation sounded like they have a co-exist, not compete-on-every-front approach, which is refreshing.
Competition
BigPanda is perhaps somewhat of a competitor to Selector. Their stated focus is broader than Selector’s: domain-neutral AIOps, correlation across the board, even BigPanda as a sort of meta-correlation and event reporting tool.
By way of contrast, Selector (also) indicates they are trying to avoid domain “deep knowledge”, but they are still apparently going to explore different domains to determine classification and context best suited for each domain, issues, reporting needs, etc. as well.
That almost sounds like one is “we do across the board (and perhaps are going to improve as we go?)” versus “we are focused on network now and going to do other domains as we grow and learn”. Different definitions of “Minimum Viable Product” and how to grow the company, perhaps?
Links
Company website: https://www.selector.ai
TechFieldDay page for Selector: https://techfieldday.com/companies/selector-ai/
TechFieldDay video recordings:
- https://techfieldday.com/video/introduction-to-selector-ai-with-deba-mohanty/
- https://techfieldday.com/video/a-deep-dive-into-selector-ai-with-nitin-kumar/
Blogs:
- https://blog.noblinkyblinky.com/2023/01/31/selector-like-spotify-but-for-your-network/
- https://artofnetworkengineering.com/2023/01/23/nfd30-gaining-intelligent-observability-w-selector-ai/
- https://gestaltit.com/tech-field-day/sulagna/ml-driven-monitoring-with-selector-ai/
- https://overlaid.net/2023/02/15/selector-is-evolving-the-way-we-operate-networks/
Let’s start a conversation! Contact us to see how NetCraftsmen experts can help with your complex challenges.