
This is the fourth and final post of a series on the network management architecture used by NetCraftsmen. The architecture is shown below, consisting of seven elements. In this post, we’ll look at Topology Mapping and discuss integrating the elements together.
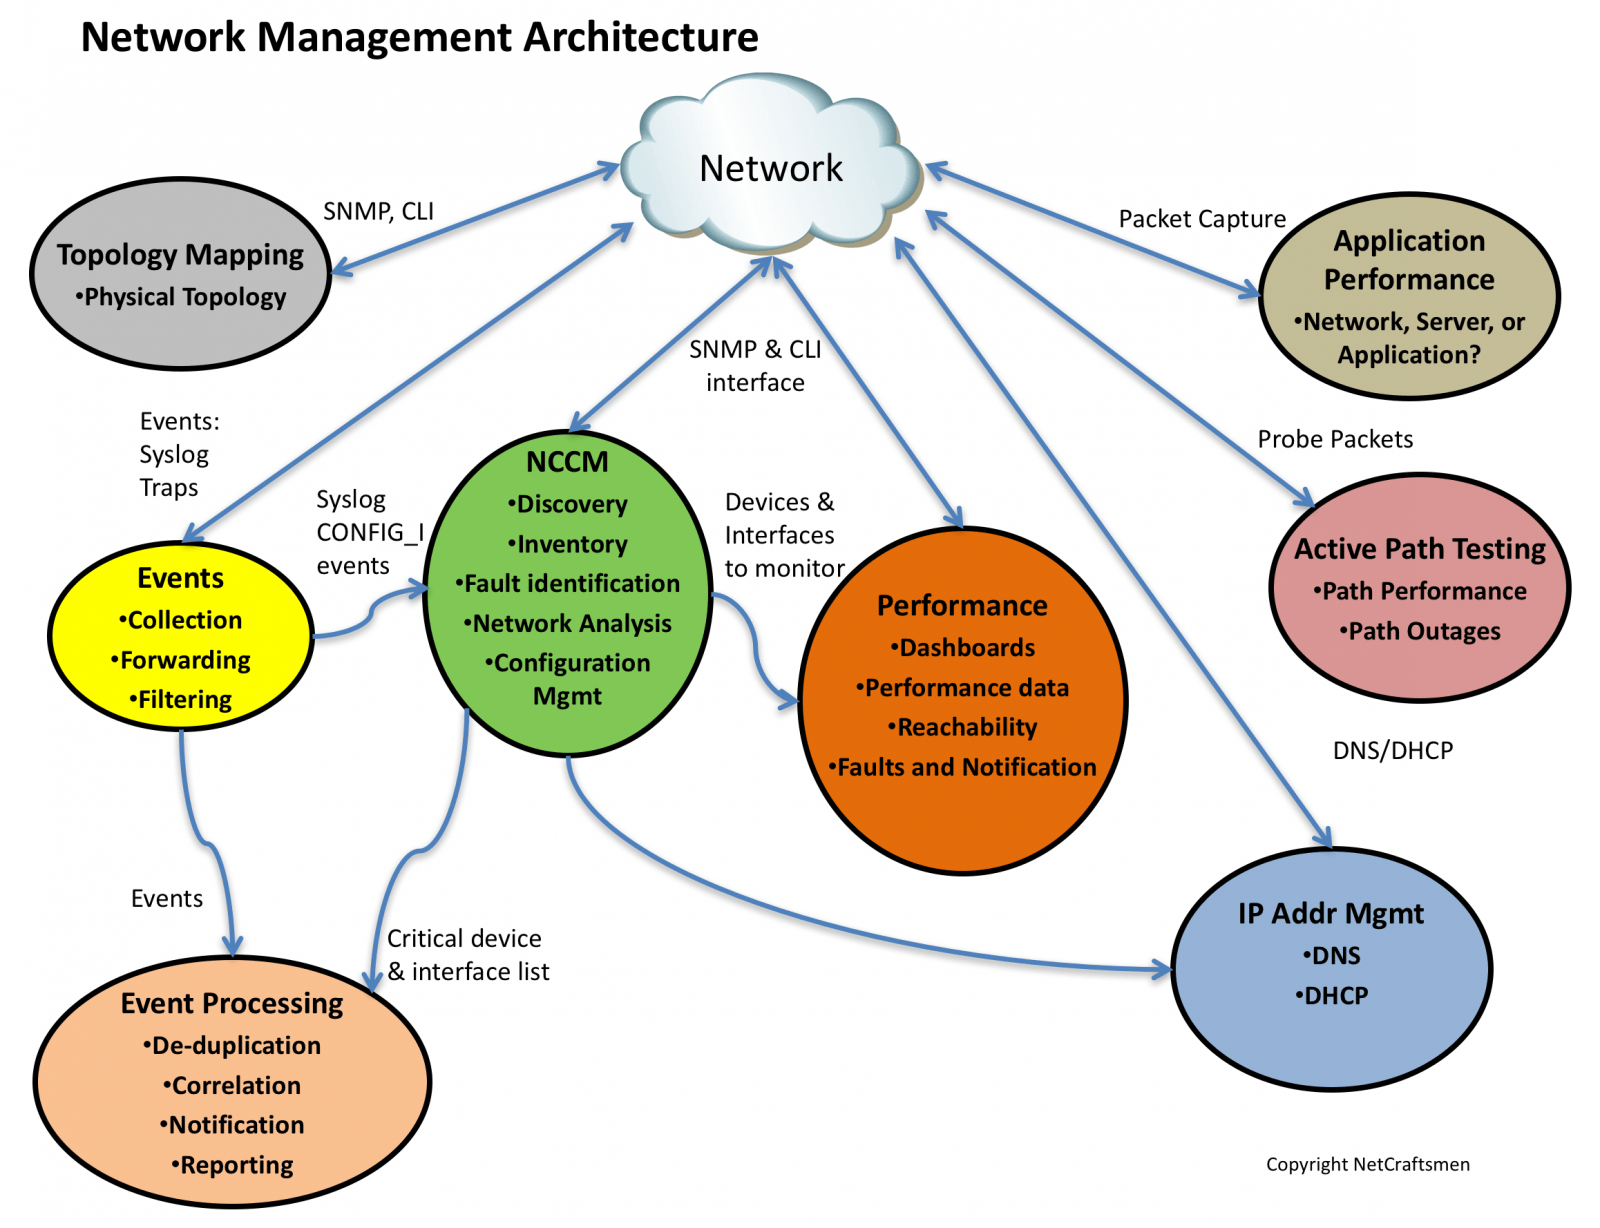
Topology Mapping
Until recently, we had not identified a good way to track the physical network topology. The basic Visio network discovery and topology creation mechanism has never worked well for us. However, we have found several tools in recent years that do network discovery and mapping. The topology maps are often Layer 1 (Physical Layer) only, which is typically what we see in most organizations. Physical layer topology is also what is typically needed for troubleshooting, although we also find it useful to understand the logical topology.
The tools that we are now seeing in the market do network discovery and mapping in Visio, which is the graphical editing tool most favored by network engineers. (If you’re on a Mac, then you may want to investigate Omnigraffle, which can read and write Visio format files.) We like the ability to edit the resulting topology maps and have the topology discovery tool use the layout as a basis for its updates, showing devices that are added and deleted from the discovery.
With an automated topology rediscovery mechanism, the topology maps are easily maintained, being regenerated every few days or once a week, as necessary. Most network topologies should not change very frequently, so a weekly update would likely be appropriate for most organizations unless a major network change was being performed.
In practice, we’ve found that the best approach is to divide the overall network topology into regions and mapping each region. The resulting topology maps are often usable when printed on notepad size paper. The core region is probably the most important, then identify other regions, perhaps based on buildings in a campus or the set of offices within a given geography. In really big networks, the non-core regions should be nearly identical to each other.
If the non-core regions are not identical, then the organization is going to have a more difficult time trying to manage the overall network. The reason is that when a problem occurs, the network team will first need to determine how the affected region is different from the other regions before starting to troubleshoot. That adds additional time and complexity to the troubleshooting effort.
Working Together
The seven elements work best together. I’ve started to see more requests from network managers for “A single pane of glass.” Unfortunately, that doesn’t really exist, even within a single vendor’s network management products. For example, a syslog message about an interface that has a high number of input errors is greatly enhanced with information about the attached device, the duplex configuration, the duplex operational state, and the interface speed. Much of this information comes from the NCCM and IPAM systems. Similarly, a failure reported by the Active Path Testing tool would benefit from interface performance information of all the interfaces along the path.
Some products incorporate an API (Application Programming Interface) that can be used to access data within the product. That can occasionally be used to integrate elements together, but requires external programming in many cases. A crude example is the Network Health Metrics chart that I created for a customer relies on a Perl script to extract data from NetMRI and from syslog-ng’s log files. It doesn’t correlate data between the systems — it is more like a mashup. I intend to investigate doing some real correlation between data in various tools as time allows so that I begin to understand more about the how to do integration and the problems that will surely arise.
Today, much of the correlation between tools has to be performed manually or using scripts like I described above. Over time, we anticipate that vendor APIs will mature and will provide the ability to share data. I’m looking forward to that day. Perhaps one day we’ll eventually get close to the “Single Pane of Glass.”
-Terry
Other posts in this series:
Re-posted with Permission
NetCraftsmen would like to acknowledge Infoblox for their permission to re-post this article which originally appeared in the Applied Infrastructure blog under http://www.infoblox.com/en/communities/blogs.html.