This is one of a small series of blogs about tools for monitoring user experience (a fancy term for response times, drop rates, etc.). I keep coming back to this topic as tools develop cool new capabilities. Since I started writing about such tools, the need to monitor cloud and SD-WAN stats has ballooned, driving the purchase and consumption of such tools.
A prior blog covered NetBeez and started with some general comments about what this type of tool does. The blog after that covered Cisco ThousandEyes.
This blog covers CatchPoint, yet another tool in roughly the same capabilities space. I emphasize “roughly.” The focus for this blog will, of course, be on what it does similarly and differently than the competitors.
For what it’s worth, I don’t intend to blog about the other competitors. A list of those I know of and consider competitors was included in the prior NetBeez blog.
Disclosure: NetCraftsmen is a Catchpoint partner and is certainly willing to sell it and related services to you.
I’ve certainly blogged enough about this kind of tool before – try putting “thousandeyes site:netcraftsmen.com” or “netbeez site:netcraftsmen.com” into your browser!
So this blog is a summary of Catchpoint capabilities intended for those unfamiliar with CatchPoint, and a comparison to the other two tools I blogged about.
What Is Catchpoint?
You already know one thing about Catchpoint … it does polling/monitoring to other sites similar to NetBeez or ThousandEyes.
Here’s a screen capture of part of the dashboard:
It shows the tests currently running and whether thresholds are met. Red and green indicate site health.
Does the agent run on a physical device or a virtual appliance? Either.
Catchpoint has agent devices scattered around the globe like ThousandEyes does, so you can poll across your own net, or to a target outside, or from the outside to inside or cloud. At the time of this writing, Catchpoint has 850 global monitoring nodes, claiming more than Cisco has (had).
Here is a screen capture showing their locations:
Pricing is pay as you go for up to a fixed number of polls over the month, or monthly fee for unlimited tests.
Their website describes the primary function as falling into four groupings:
- Synthetic monitoring
- Network monitoring
- Real user monitoring
- Endpoint monitoring
Let’s take those one at a time.
Tests
Here is a screen capture of the form to create a new instant test.
Synthetic monitoring
The page describing Synthetic Monitoring indicates that the tests (monitoring) you run can be any of the following 20 types: web, transaction (selenium script), HTML code, API, WebSocket, DNS, FTP, transport, SMTP mail, ping, traceroute, NTP, IMAP, folder, product, or custom.
They separately mention MQTT for IOT, UDP, TCP, streaming, SSL, API transactions, WiFi signal strength and other metrics, and custom monitors (VoIP, database, correlation of performance metrics with Twitter comments or Google LightHouse).
Real user monitoring
This is RUM similar to that used by high-end application performance tools common within sites. Specifically, you can get metrics on response time to reach various key points in web page or application code, to help you improve the web or other (internally developed) application performance. Or do API monitoring.
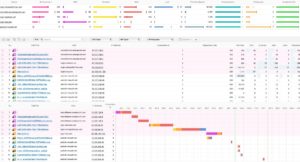
Here’s a screen capture from a sample waterfall analysis:
Network monitoring
Catchpoint also does Network Monitoring. This heading covers:
- Traceroute monitoring
- BGP monitoring
- DNS monitoring
- SaaS and WiFi, etc.
See the above link for more info.
Endpoint monitoring
Endpoint Monitoring provides measurements from user devices to applications, including the claimed ability to distinguish between device and network problems. It detects device and network health issues and provides self-help advice on remediation. It also monitors the user’s bandwidth capacity.
It also provides information about which applications the user uses and how often they use them. (Think licensing.)
So, What Is Special about Catchpoint?
My impression is that the RUM functionality is the biggest differentiator from the competition.
Other items I noticed:
- Built-in secure links for sharing what you see … team troubleshooting, show provider what you’re seeing …
- APIs and integration (Slack, Splunk, ServiceNow, …)
Update
As of late September 2021, Catchpoint announced they are rolling out a revised GUI called Symphony. The focus is ease and speed of operation, with a more consistent user interface. To that end, Catchpoint has re-grouped items such as tests, which formerly were somewhat less unified, configured in different ways. They also tested to see what took users more time, where user errors and problems tended to occur, and whether their changes improved things. Use of the new GUI will be optional for some period of time.
Relevant Prior NetCraftsmen Blogs
NetCraftsmen has several posted blogs on the topic of Digital Experience / User Experience:
- https://netcraftsmen.com/digital-experience-monitoring-addressing-those-nagging-network-performance-problems/
- https://netcraftsmen.com/switch-to-digital-experience-monitoring/
- https://netcraftsmen.com/poor-work-from-home-application-performance-drives-digital-experience-dx-monitoring/
- https://netcraftsmen.com/digital-experience-dx-monitoring-intermittent-bgp/
Conclusions
Catchpoint has an interesting set of capabilities, distinguishing them from the competition. Each such vendor has its own strengths and weaknesses or different functionalities. That may also tie into pricing: TANSTAAFL.


