This is the third in a series of blogs, the DNAC Tour.
Prior blogs in this series:
- DNAC Tour Part 1: Introduction to Cisco DNA Center
- DNAC Tour Part 2: DNAC Instant Demo: Beginning Your Tour
The last blog completed our top-level tour of the DNAC dashboard and selected features.
(Some might say: random features. But there was a method to the madness)
Assurance
Now we’ll take a closer look at drilling down and, in particular, the Assurance/Troubleshooting capabilities.
DNAC is not going to compete for your job, but it is intended to help you do it better and faster!
>>>Documentation: Cisco DNA Assurance
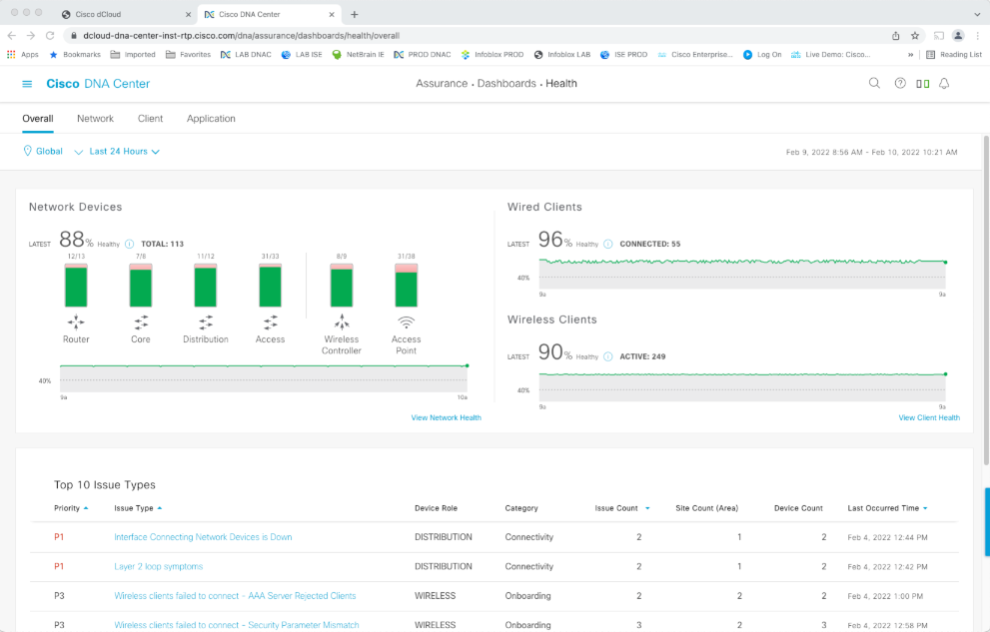
Tour item: Assurance/Troubleshooting. Click on the Cisco DNA Center text at the top of the display to get back to the Dashboard. Under Health, click on “View Details.”
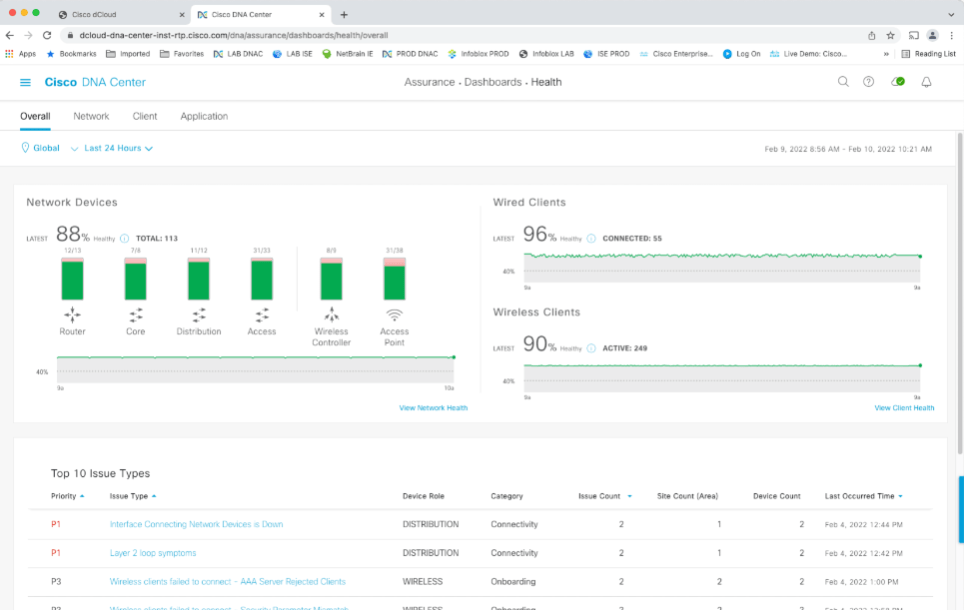
The colored bar segments are clickable for details. The upper right shows wired and wireless clients and the overall health score for each category. (Feel free to explore, it is easy enough to get back to this point.)
Scroll as needed and look at the Top 10 Issue Types.
Click into the first issue: down interface.
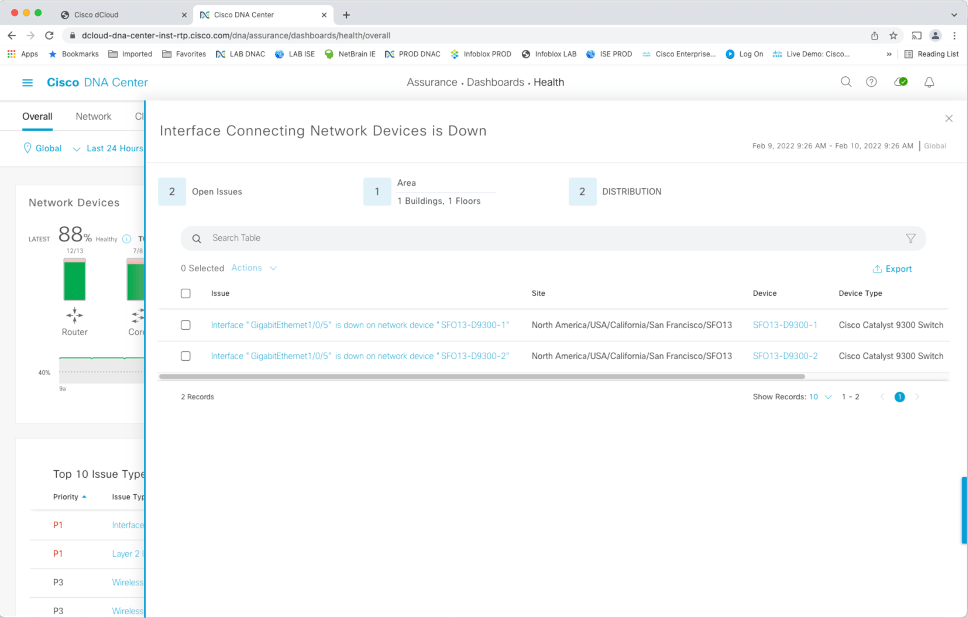
Then click into the first instance of a down interface. You should see something like the following:
Machine Reasoning
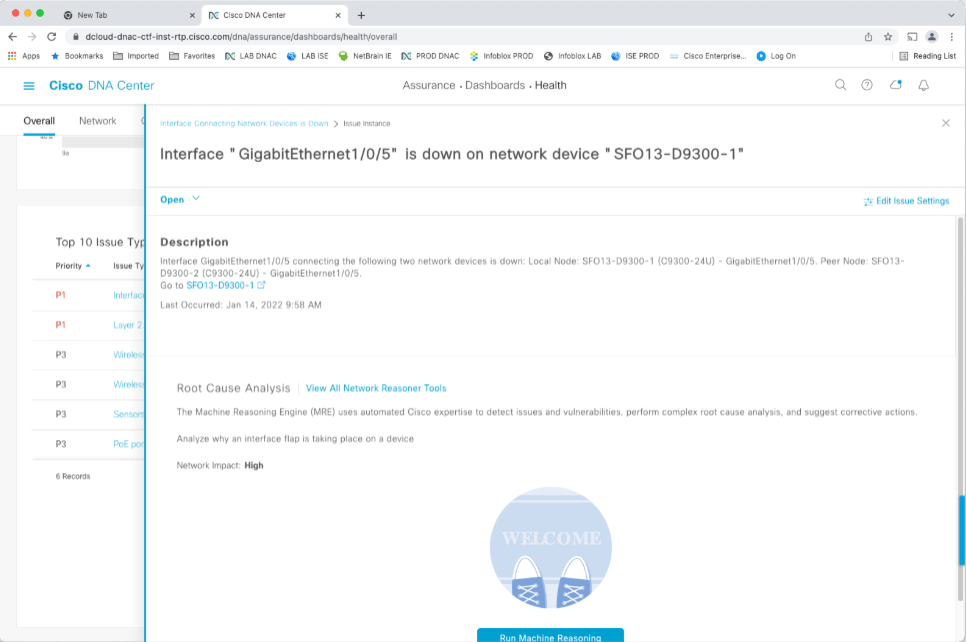
Tour item: Click on “Run Machine Reasoning” at the bottom of the screen.
You will see something like the following:
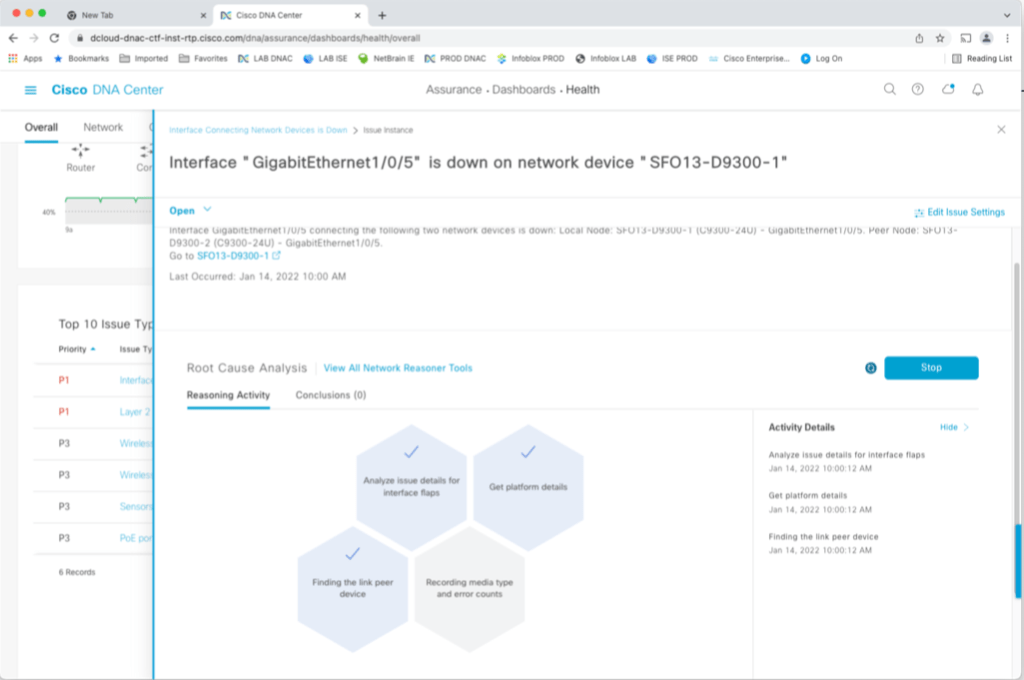
Which will turn into the following as the automated tasks get completed:

That will quickly be covered up by the following pop-up dialog box:
(It was a bit challenging to get the screen capture before the dialog box!)
The point of this is that DNAC is going and collecting information for you. You don’t have to connect and type show commands!
In the pop-up, click on View Details. That brings you to … the details!
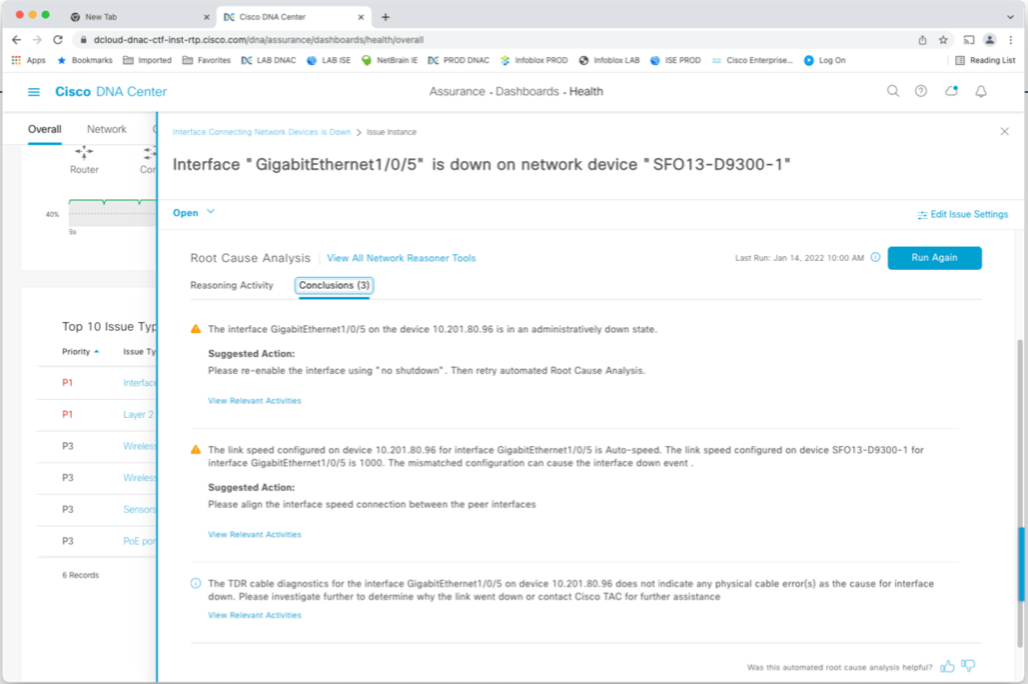
This problem was, of course, rather simple. But DNAC will show you what it checked and make suggestions for how to fix the problem. You can make changes and then click “Run Again” to see if that improved things.
Network Reasoner
Tour item: Go to Tools -> Network Reasoner to see the things DNAC currently knows about, either to report as problems and/or to fix them.
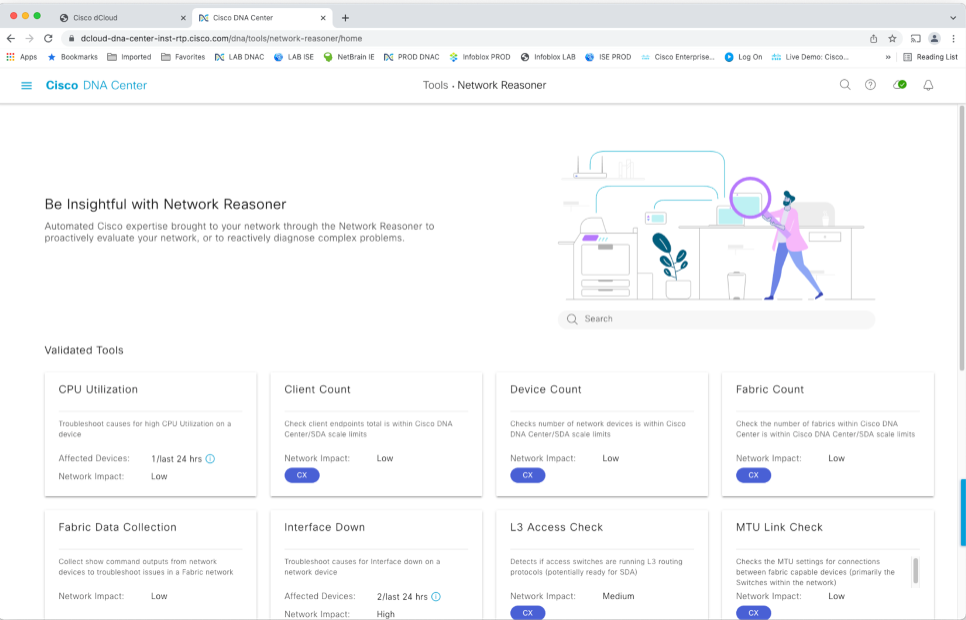
The relevant documentation chapter:
>>>Documentation: Troubleshoot Network Devices Using Network Reasoner
Tour item: Go to Assurance -> Dashboards -> Issues by going to the Dashboard, finding the Critical Issues box, and clicking on View Details. Or by following the “bread crumbs”: menus, Assurance, then Issues.
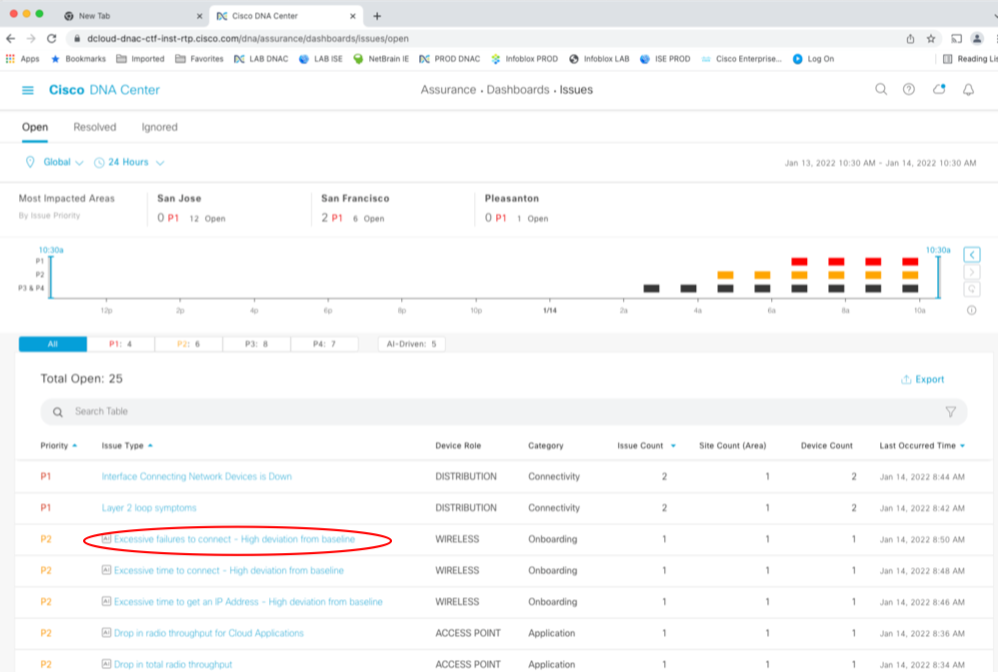
Note the priority or severity of each item is color-coded and correlates with the timeline at the top of the screen.
Note the Excessive failures to connect items. This is reporting that there are more than the usual number of failures to connect (WiFi).
Click into it.

The click into the one item that shows when you do that. You’ll see all sorts of information, like the following:
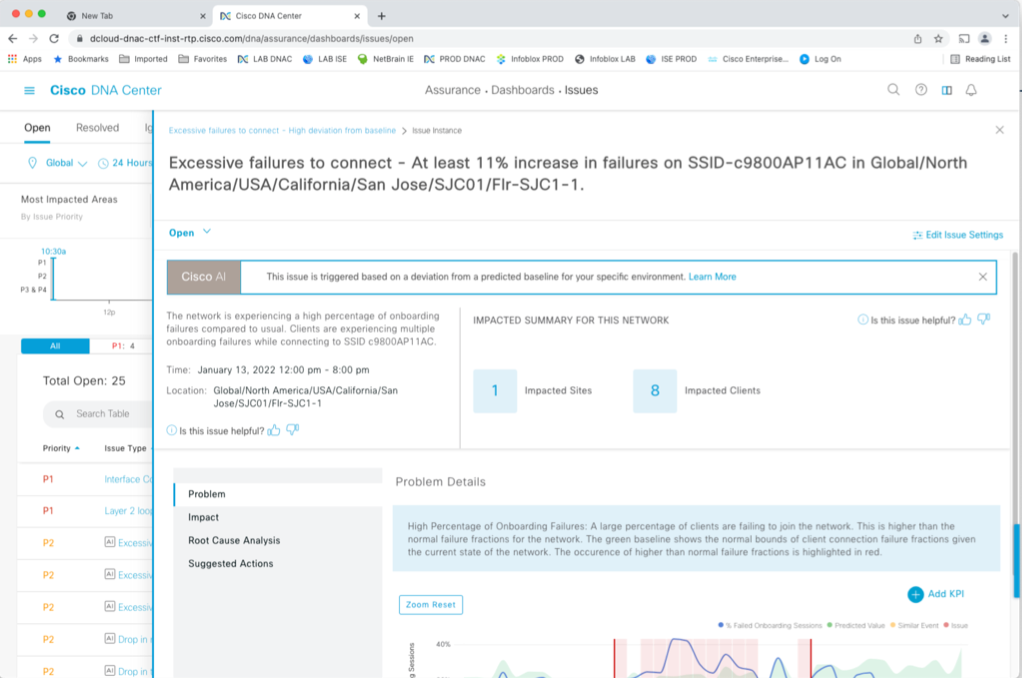
You can click on Impact, etc., for more information, including probable causes.
Note the graph at the bottom right. This shows the metric (number of failures) with a colored band around it. The green band reflects “normal” as predicted, and red highlights where the number of failures is outside the green band.
Health
Tour item: Go to Assurance -> Dashboards -> Health, either via the menus or via the Dashboard, Health section, View Details.
Click on the Client tab.
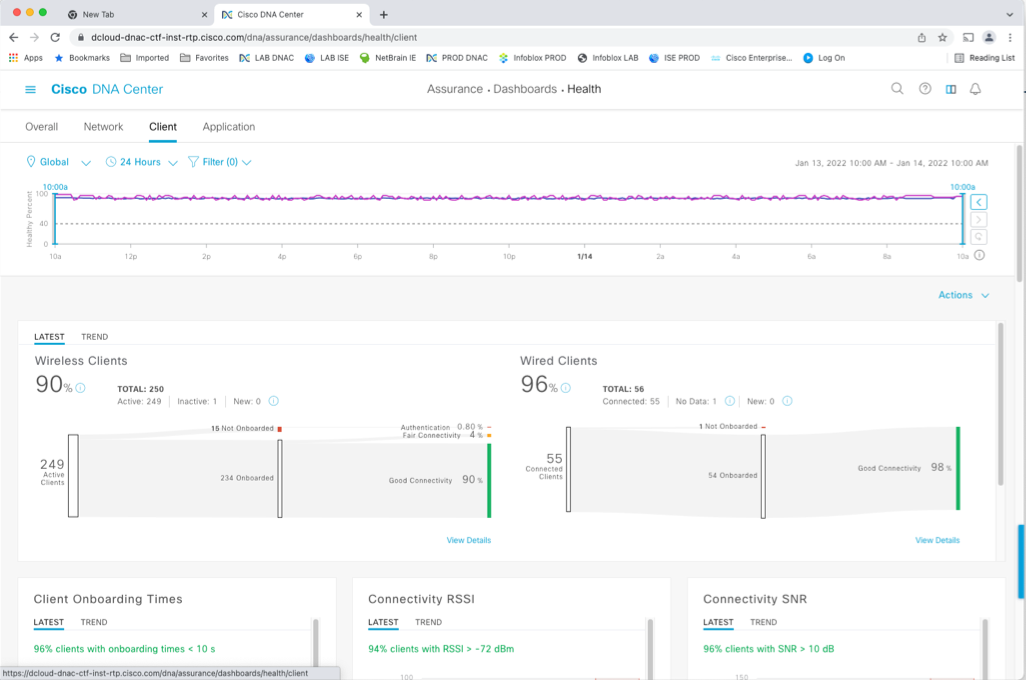
Feel free to explore this page. For instance, if you drill down on Wireless Clients (“View Details”), you’ll see a bit more detail.

Scroll down, and you’ll find WLAN health reporting per user!

You can then click on a user’s name to see even more (“Client 360”).
However, the next tour item will get us to similar info a different way.
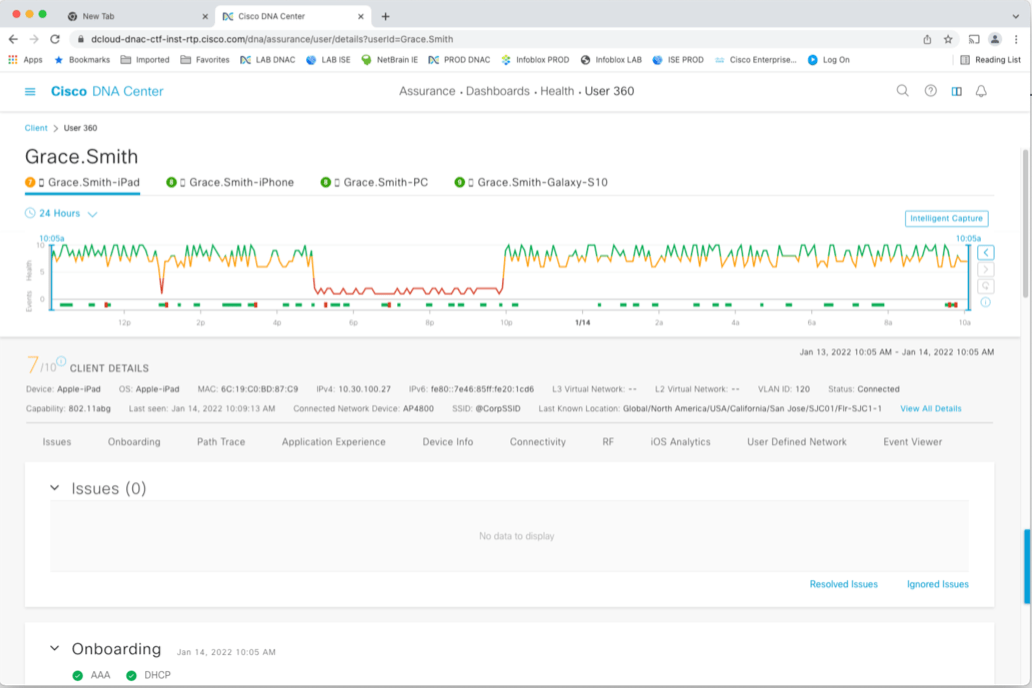
User 360
Tour Item: If you go to the magnifying glass icon at the top right of the DNAC screen and type in “Grace,” you’ll see the four devices Grace is using.
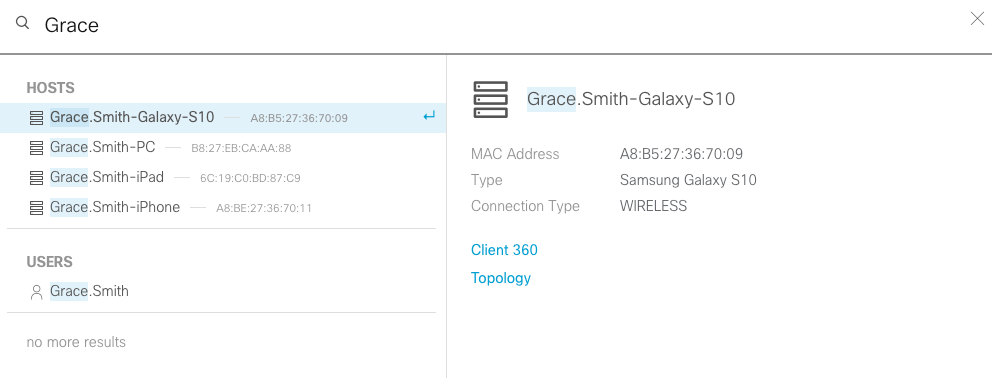
Below that, you’ll see USERS. Double-click on the Grace.Smith link below that (for the user overall, rather than any specific device).
That brings up information about Grace’s connection over time at the top. With green, yellow, and red on the graph. You can use the tabs above the graph to select which of Grace’s four devices to show information about.
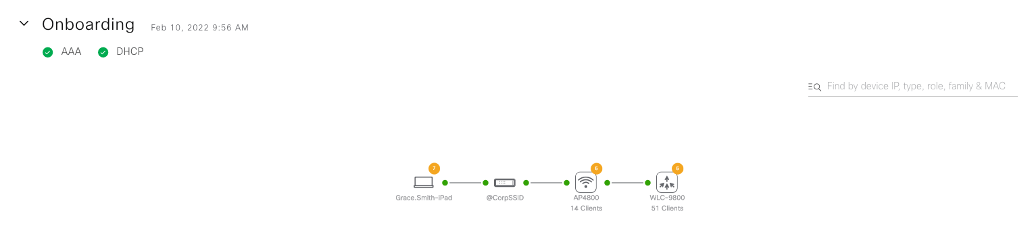
If you scroll down, you’ll see a little diagram of how Grace is connecting (“Onboarding”), along with color-coded dots for the health score of each device involved.
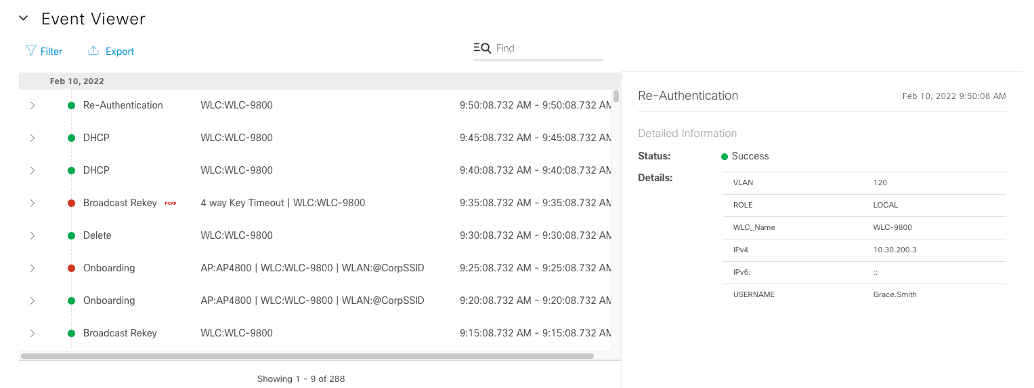
The Event Viewer below that shows a history of Grace’s wireless connection.
Below that, the Application Experience shows QoS information for various applications Grace is running. (You’ll need to expand the section by clicking on the header.)
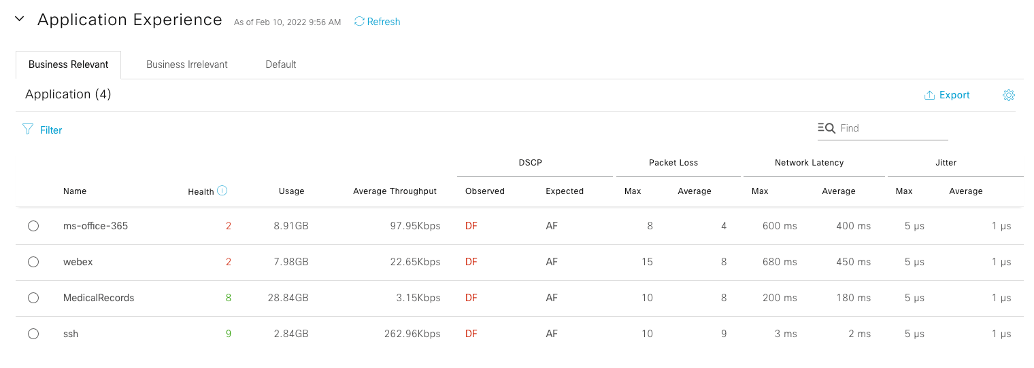
Note the tabs up top for the three QoS “buckets.”
The “DF” and “AF” refer to default forwarding versus one of the AF levels of forwarding. QoS problem!
If you scroll further down, Detail Information shows other possibly useful information. Click the tabs to see the various type of information, especially Connectivity and RF. DNS is important too!

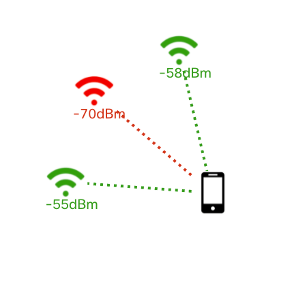
The little diagram at the bottom shows the various APs that the device in question is seen on, with color coding for signal strength.
A Moving Experience
Tour Item: Scroll back up to the top of the USER Grace.Smith page. In the upper right, you’ll see a box titled “Intelligent Capture.” Click on it. You should see something like the following in the right portion of the display.
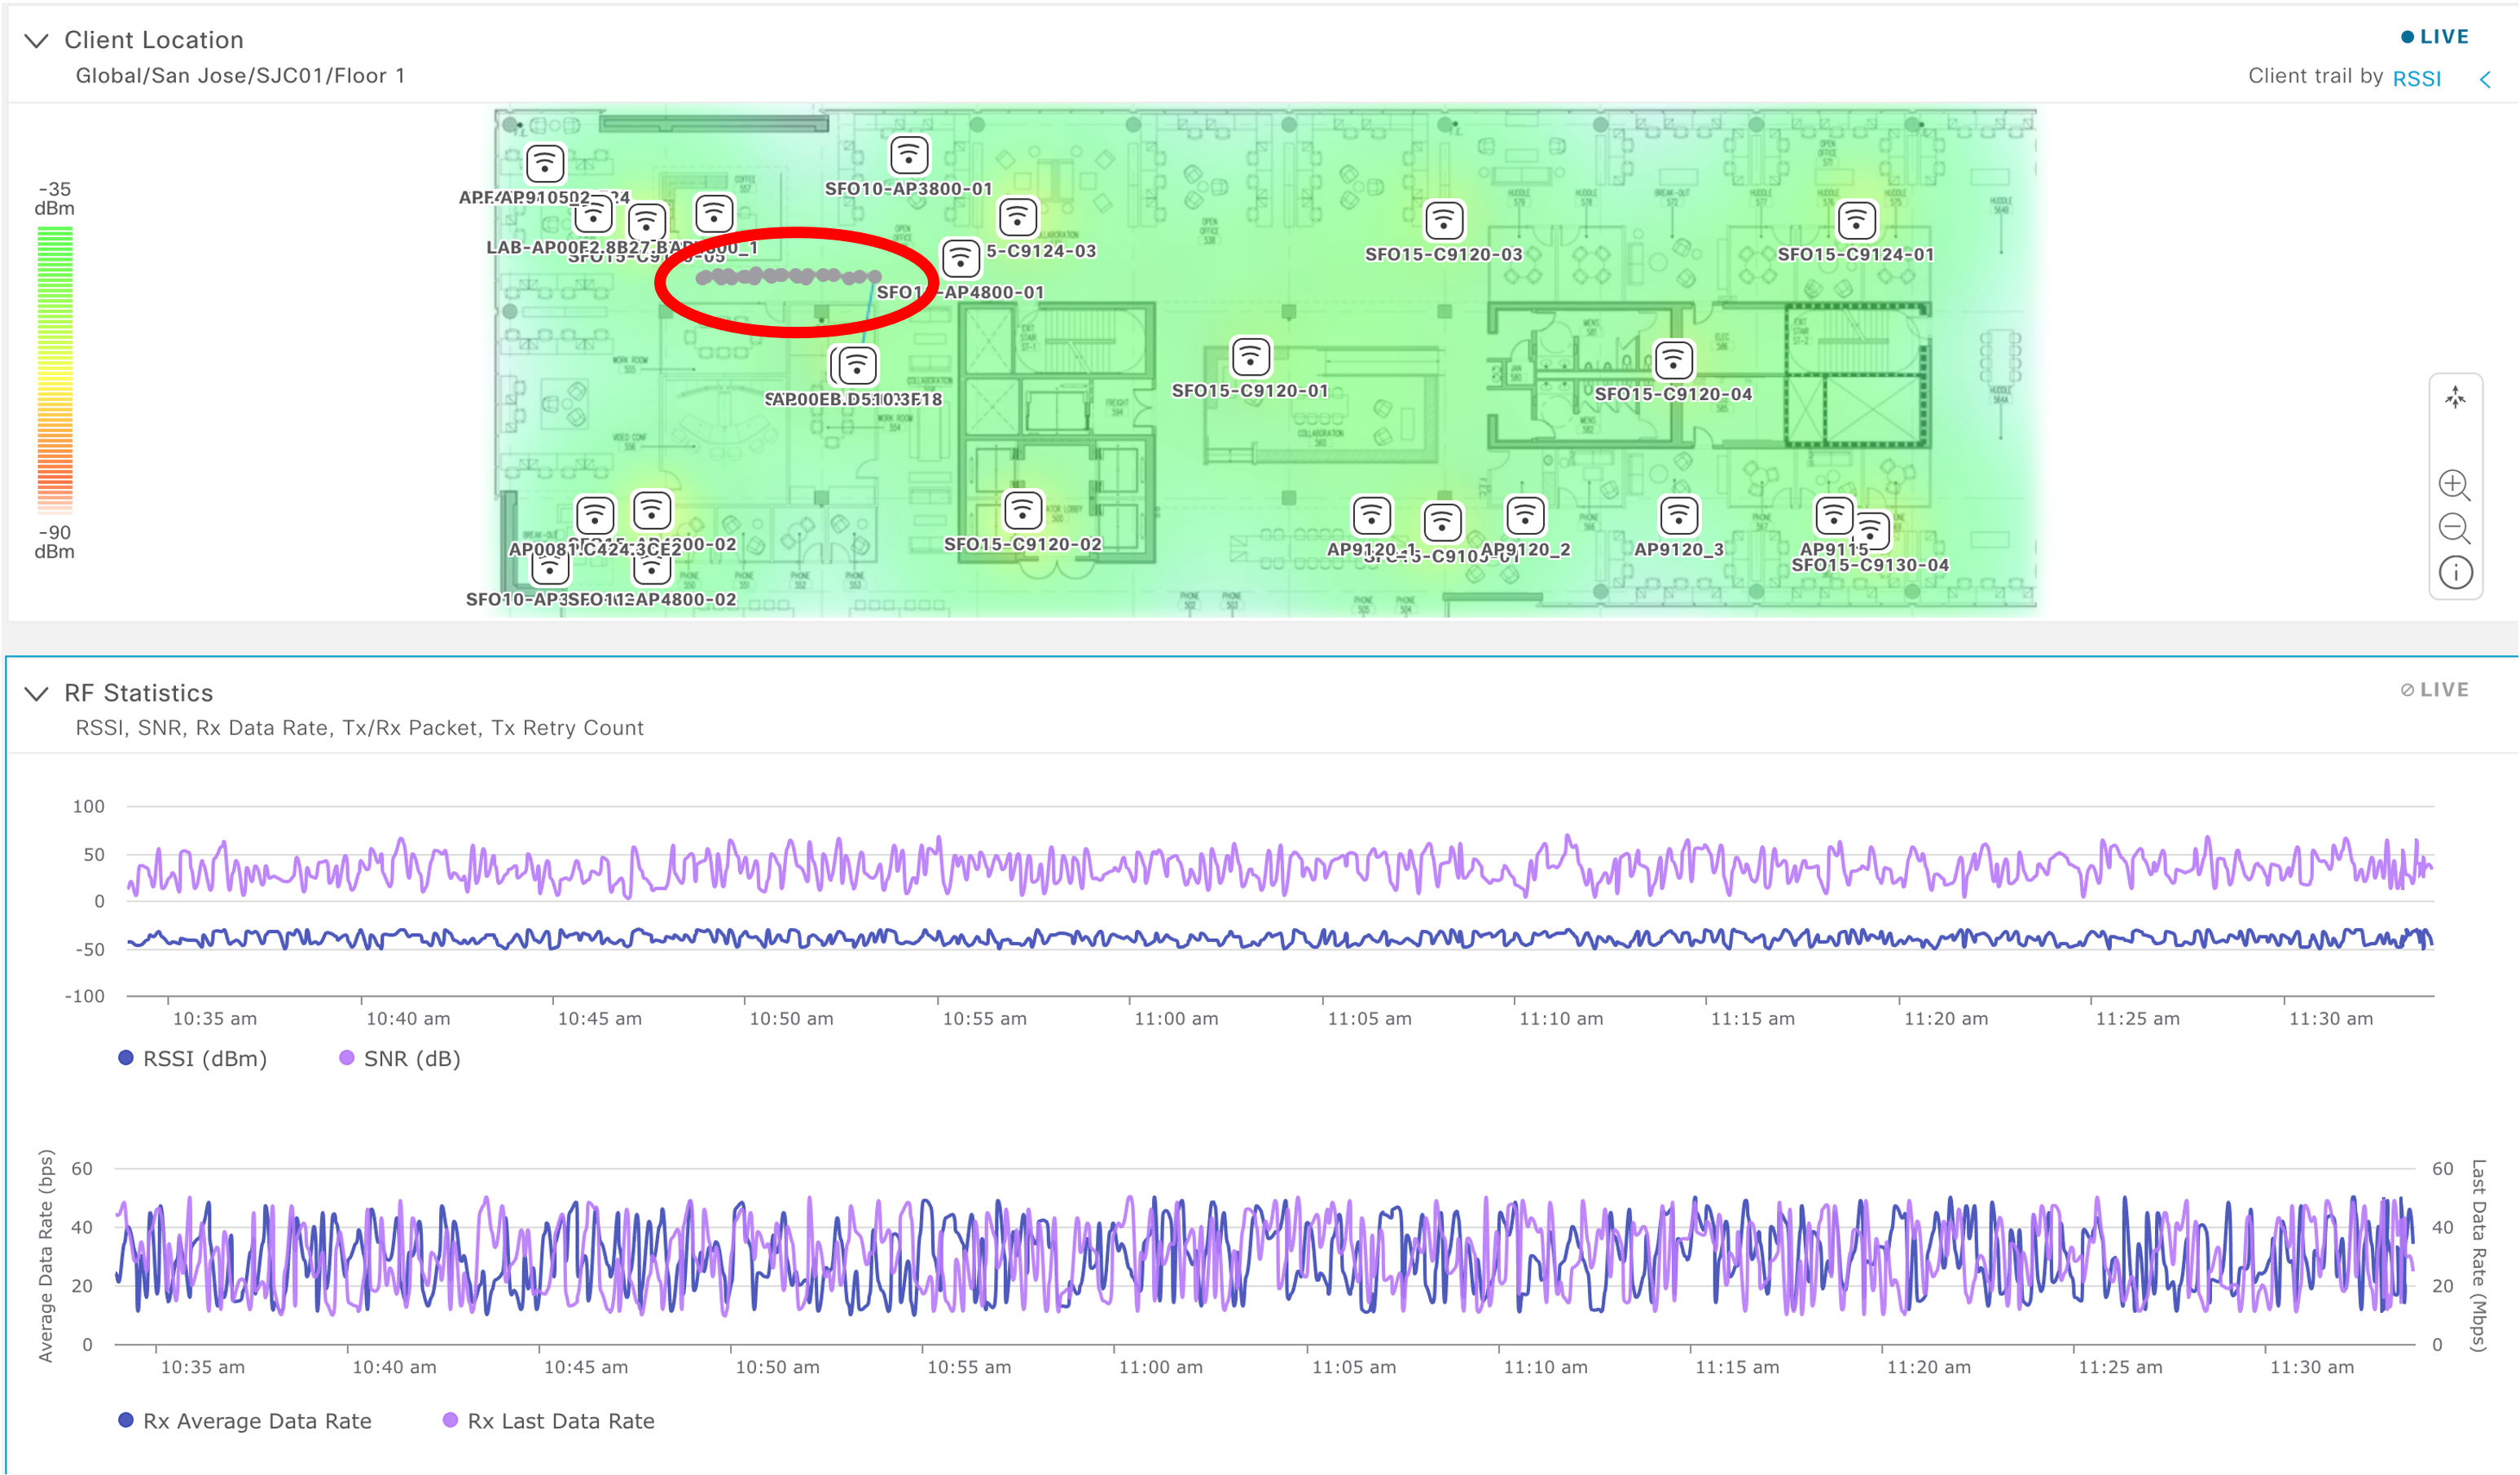
It turns out Grace is a robot moving back and forth in the location in question. I circled the path in red in the screen capture above. If you watch the gray dots, it moves.
Note: If you’re having trouble with this, be aware that you need to get to the above screen exactly as described. Clicking on a device brings up a very similar screen but without the Intelligent Capture box, apparently!
Tour Note: At this point, you’ve sampled just some of the Assurance (Quality of Experience and Troubleshooting) functionality in DNAC.
Cisco’s Assurance self-guided tour document suggests some other activities. Or explore on your own!
Conclusion
Now you can be assured you know the sorts of things Assurance can do. There’s much more, but the previous tour should be enough to set you up to do further exploration on your own.
![]()